
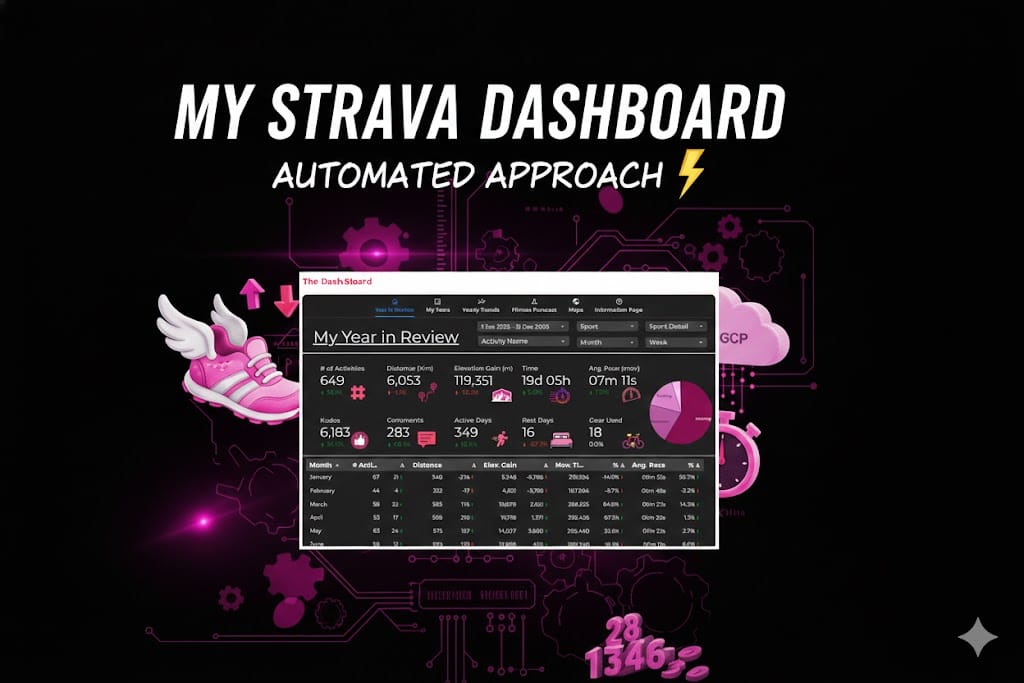
My Strava Dashboard: An Automated Approach
TLDR: “I automated my Strava data so I can spend less time looking at my laptop and more time getting lost on trails. Check out how I built a 100% cloud-automated fitness dashboard.”
We’ve reached that time of year again. My social feed is currently a graveyard of Spotify Wrapped stats and “Year in Review” infographics. Strava’s version is… fine. It tells me I ran a lot and probably spent too much money on gels.
But as a data person, a once-a-year few pages of stats doesn’t cut the mustard. I didn’t want a participation trophy; I wanted a command center. I wanted to see how my 2025 hill repeats compared to 2018, and I wanted it to update while I was out actually doing the miles—not while I was hunched over a keyboard hitting “Run Script.”
The Build: Moving from Manual to "Mach 1"
To get this off the ground (and into the cloud), we built a four-stage pipeline that handles the heavy lifting so I don’t have to. Here is the “Pro” setup:
- The Handshake (Strava API): We tapped into the Strava API using OAuth 2.0. This isn’t just a simple download; it involves a system of refresh tokens that allow the dashboard to keep its “all-access pass” to my data without me having to log in every morning.
- The Brain (Python & Pandas): I (with the help of my trusty assistant, Gemini) wrote a Python script that acts as a digital filter. It pulls over 60 columns of raw data—everything from heart rate to polyline map coordinates—and transforms them. We’re talking unit conversions (meters to km), date-granularity breakdowns, and custom “Efficiency Ratios” (Moving Time vs. Elapsed Time).
- The Warehouse (Google Sheets): Instead of a complex SQL database, we used Google Sheets as a lightweight data warehouse. It’s accessible, easy to audit, and plays perfectly with our visualization layer.
- The Automation (Google Cloud Functions & Scheduler): This is the secret sauce. The script lives in a Google Cloud Function (a serverless “worker”). I set up a Cloud Scheduler (essentially a digital alarm clock) to trigger that function every morning at 8:00 AM.
The result? I go for a run, the cloud wakes up, fetches the data, processes the map, updates the spreadsheet, and the dashboard is ready before I’ve even finished my post-run coffee.
The Evolution: From Sumo to Strava
If you saw my previous post on the Sumo Data Master dashboard, you know I love a good trendline. But that project was like a manual transmission—it only worked when I sat down at my local PC and ran the code.
The Strava Dashboard is a different beast. It’s fully “Set and Forget.” While the Sumo project taught me how to analyze data, this project taught me how to engineer it. We moved from a local script to a live, cloud-native application.
Why Bother? (The 100-Mile Motivation)
You might ask: “Ross, isn’t this overkill for a morning jog?” Maybe… But I have my sights set on the UTMB 100-miler this year and praying to the lottery gods that I get in. When you’re training for 100 miles, “vibes” aren’t a training plan. I need to track my cumulative elevation gain over years, know what works for me and be mountain-ready before hitting the start line.
It was also fun and a challenge to see if I could get it working with full automation.


