Cyberpunk 2077: A Personal Crisis Caused by a Digital Ghost
SPOILER WARNING: The following post contains major spoilers for the main story and endings of Cyberpunk 2077. If you haven’t sat through the credits yet, you might want to jack out now.
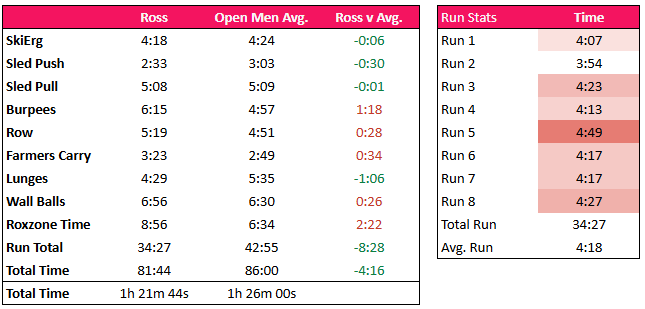
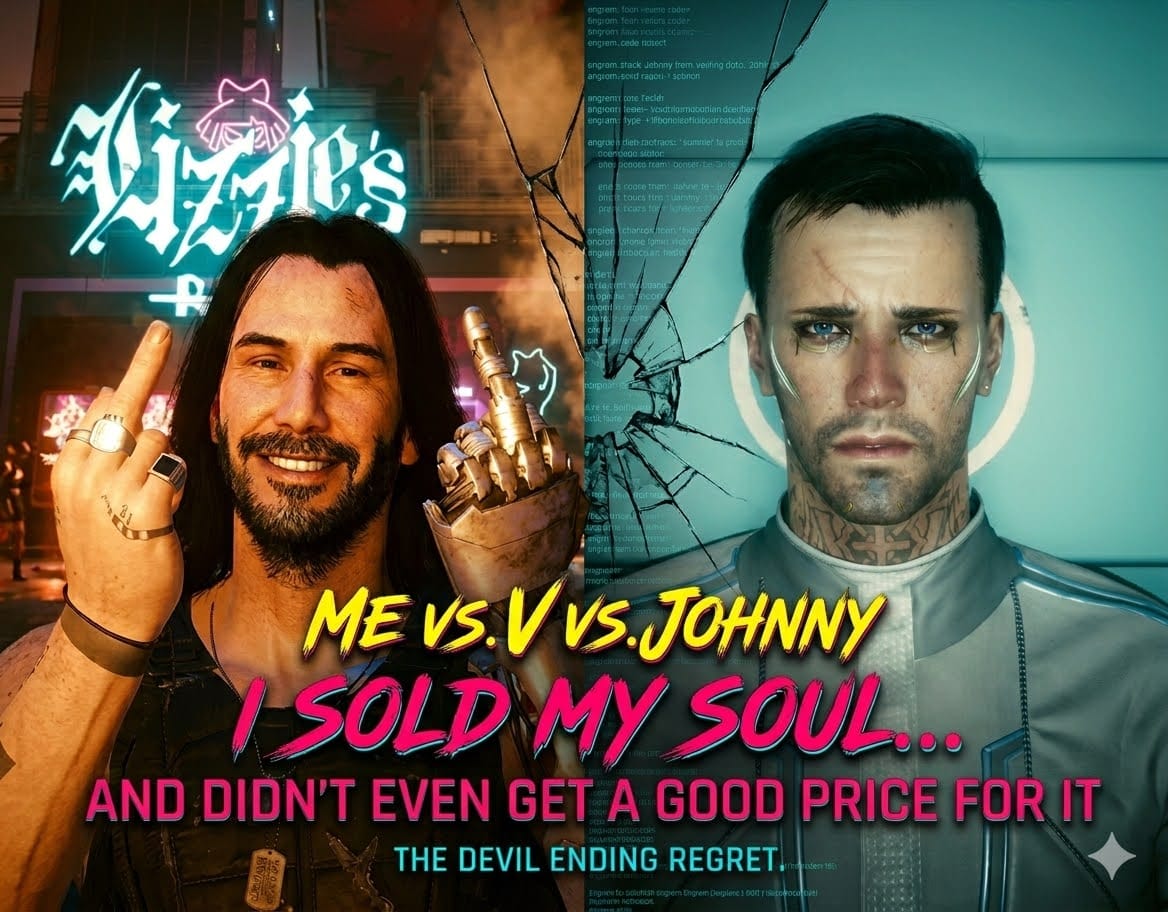
TLDR: Night City won. I sold my soul to Arasaka for a sterile lie and lived to regret betraying Johnny. A raw look at identity, corporate dystopia, and why I’m going back to burn it all down.
I. The Surreal Aftermath
I’ve just finished my first playthrough of Cyberpunk 2077 (base game)… and I lay in bed last night struggling failing to fall asleep because I feel as if there’s a haunting voice in the back of my mind saying
“I’ll tell you what I see. I see a dead man walkin’. A man who’s lost everything, even his own soul.”
For the previous few days, I’ve been trying to process what just happened. To put it plainly: it was a surreal experience. I’ve played a lot of games—The Witcher 3, Elden Ring, even Hogwarts Legacy and usually, I walk away feeling like I mastered the narrative. I make my choices, I accept the outcomes, and I move on. But this? I’ve never played out a story like it. For the first time in my life as a gamer, I found myself paralyzed by the dialogue. I genuinely didn’t know what the “right” answer was.
It wasn’t just a game; it felt like a direct interrogation of my own ethics and morality. I’m left with a feeling of profound regret that I didn’t see coming.
II. True Immersion in a Technological Dystopia
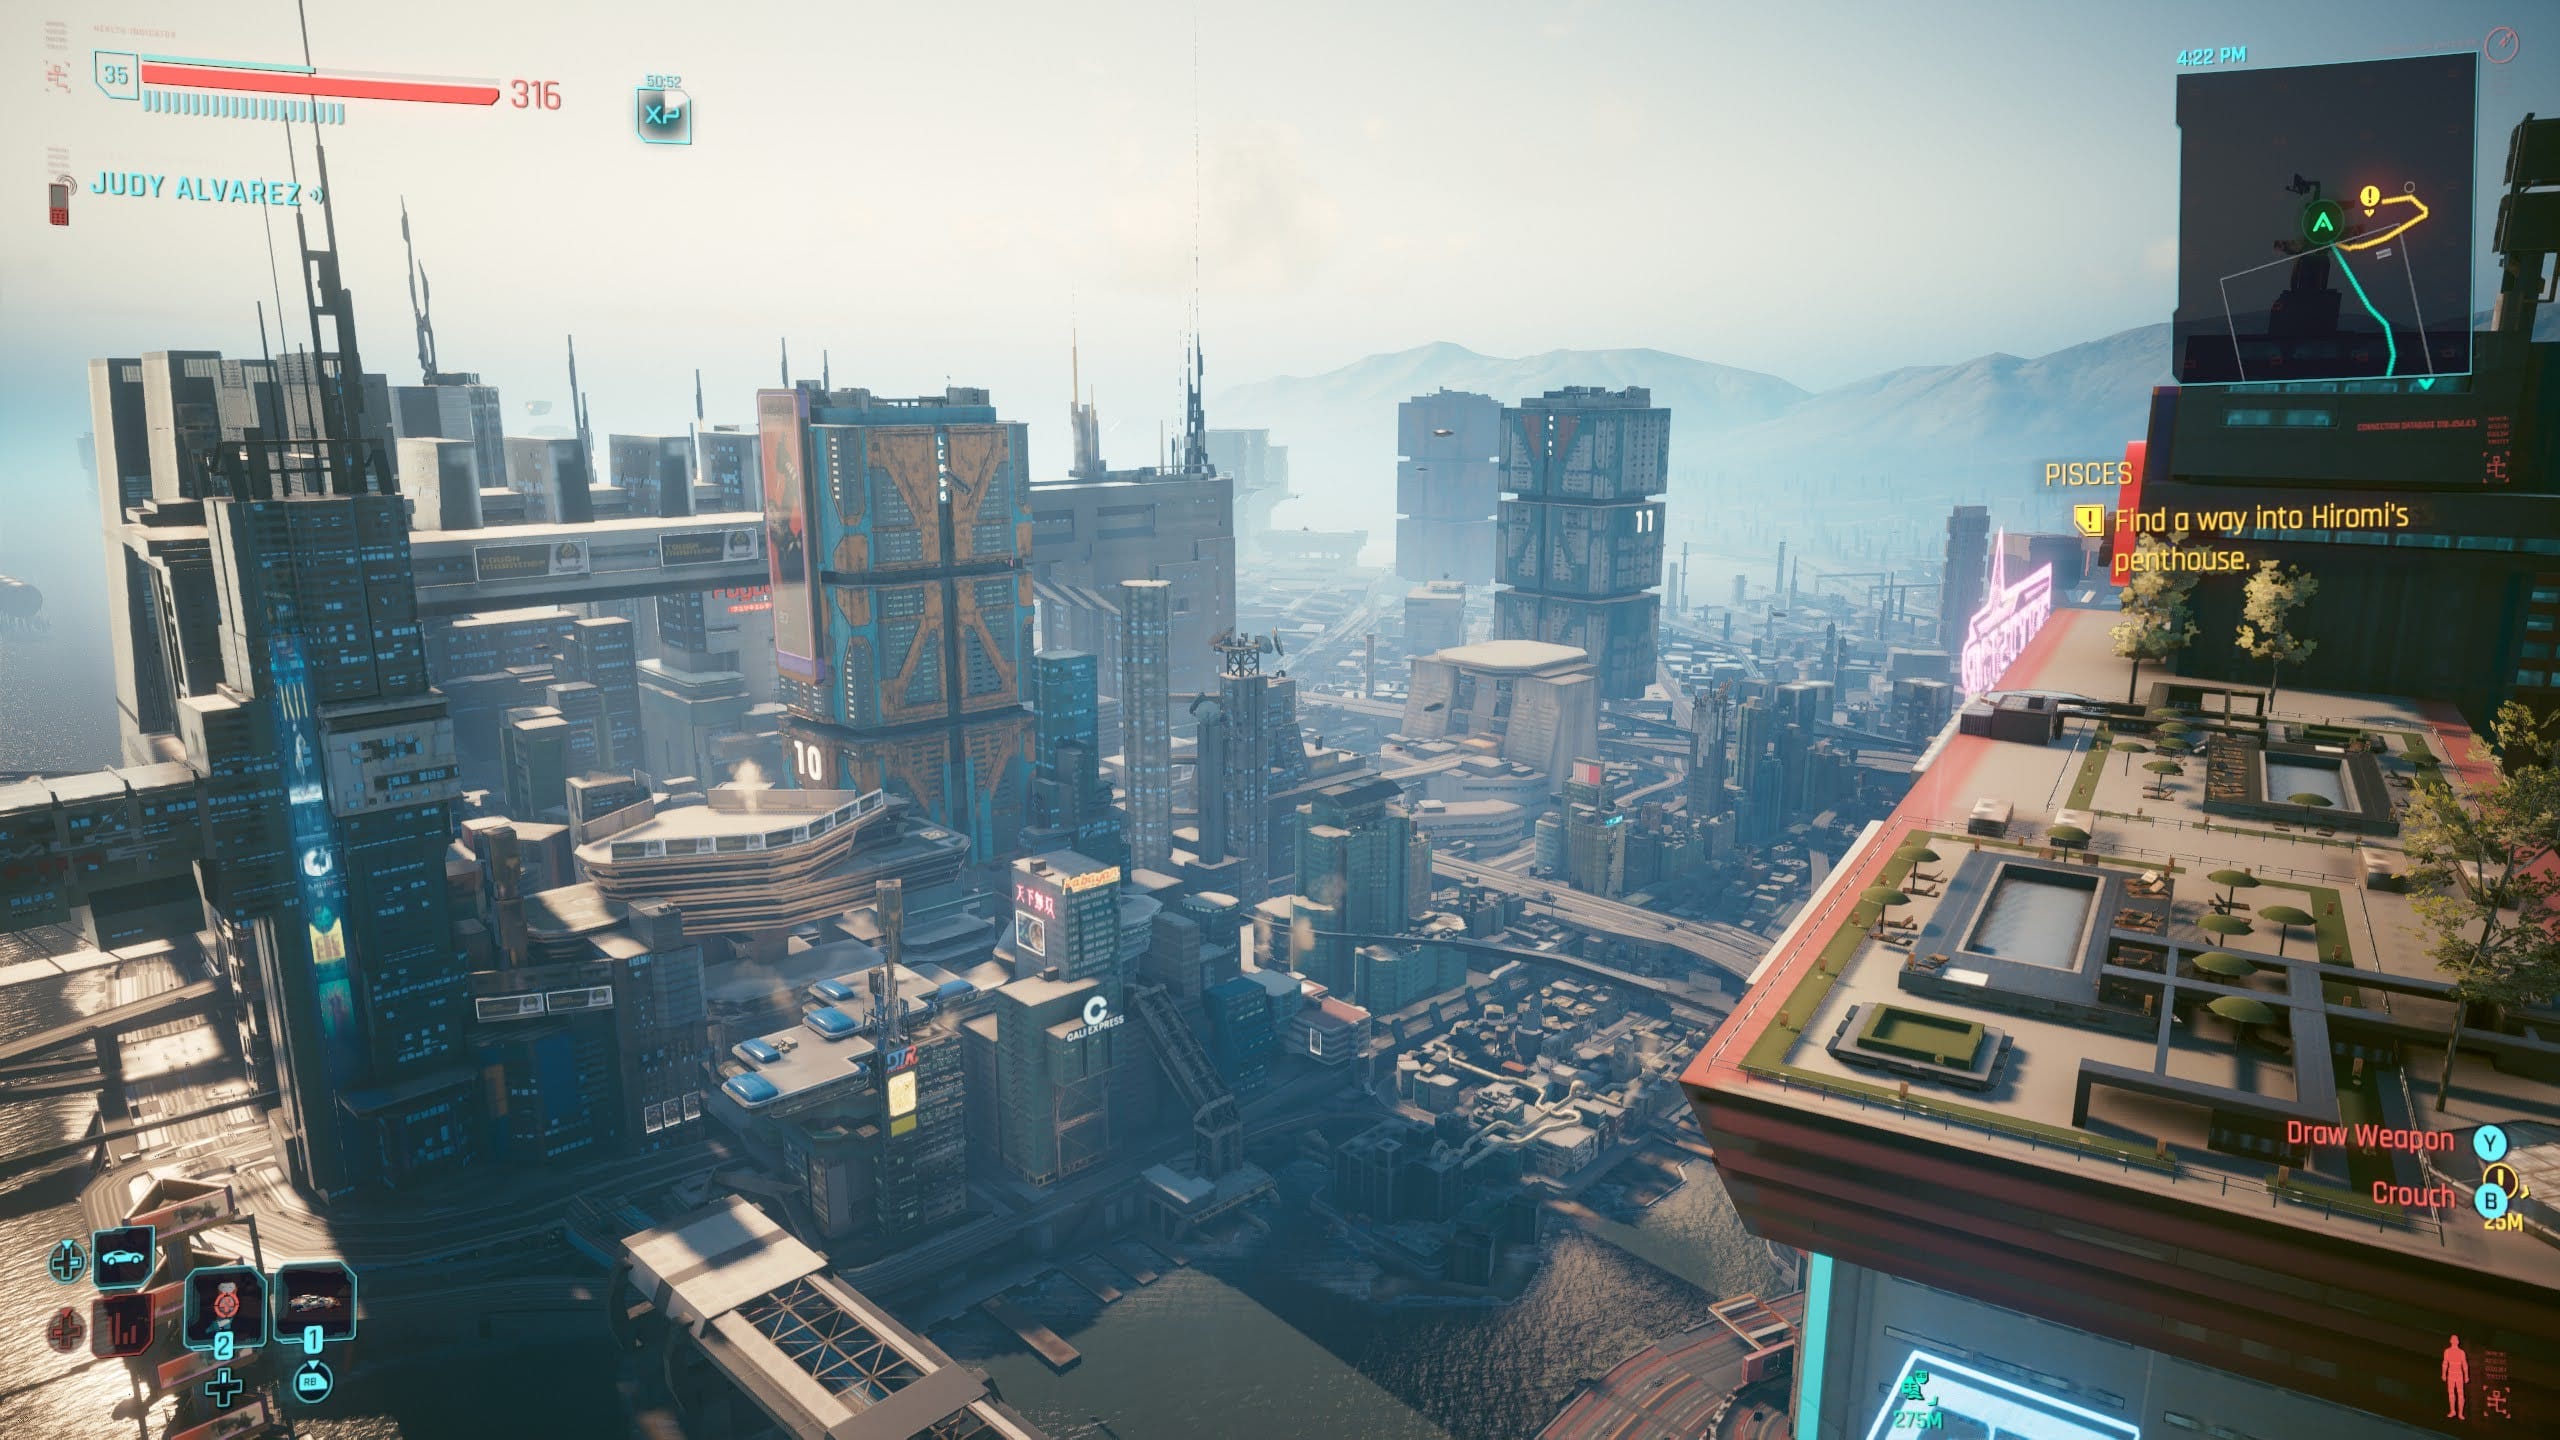
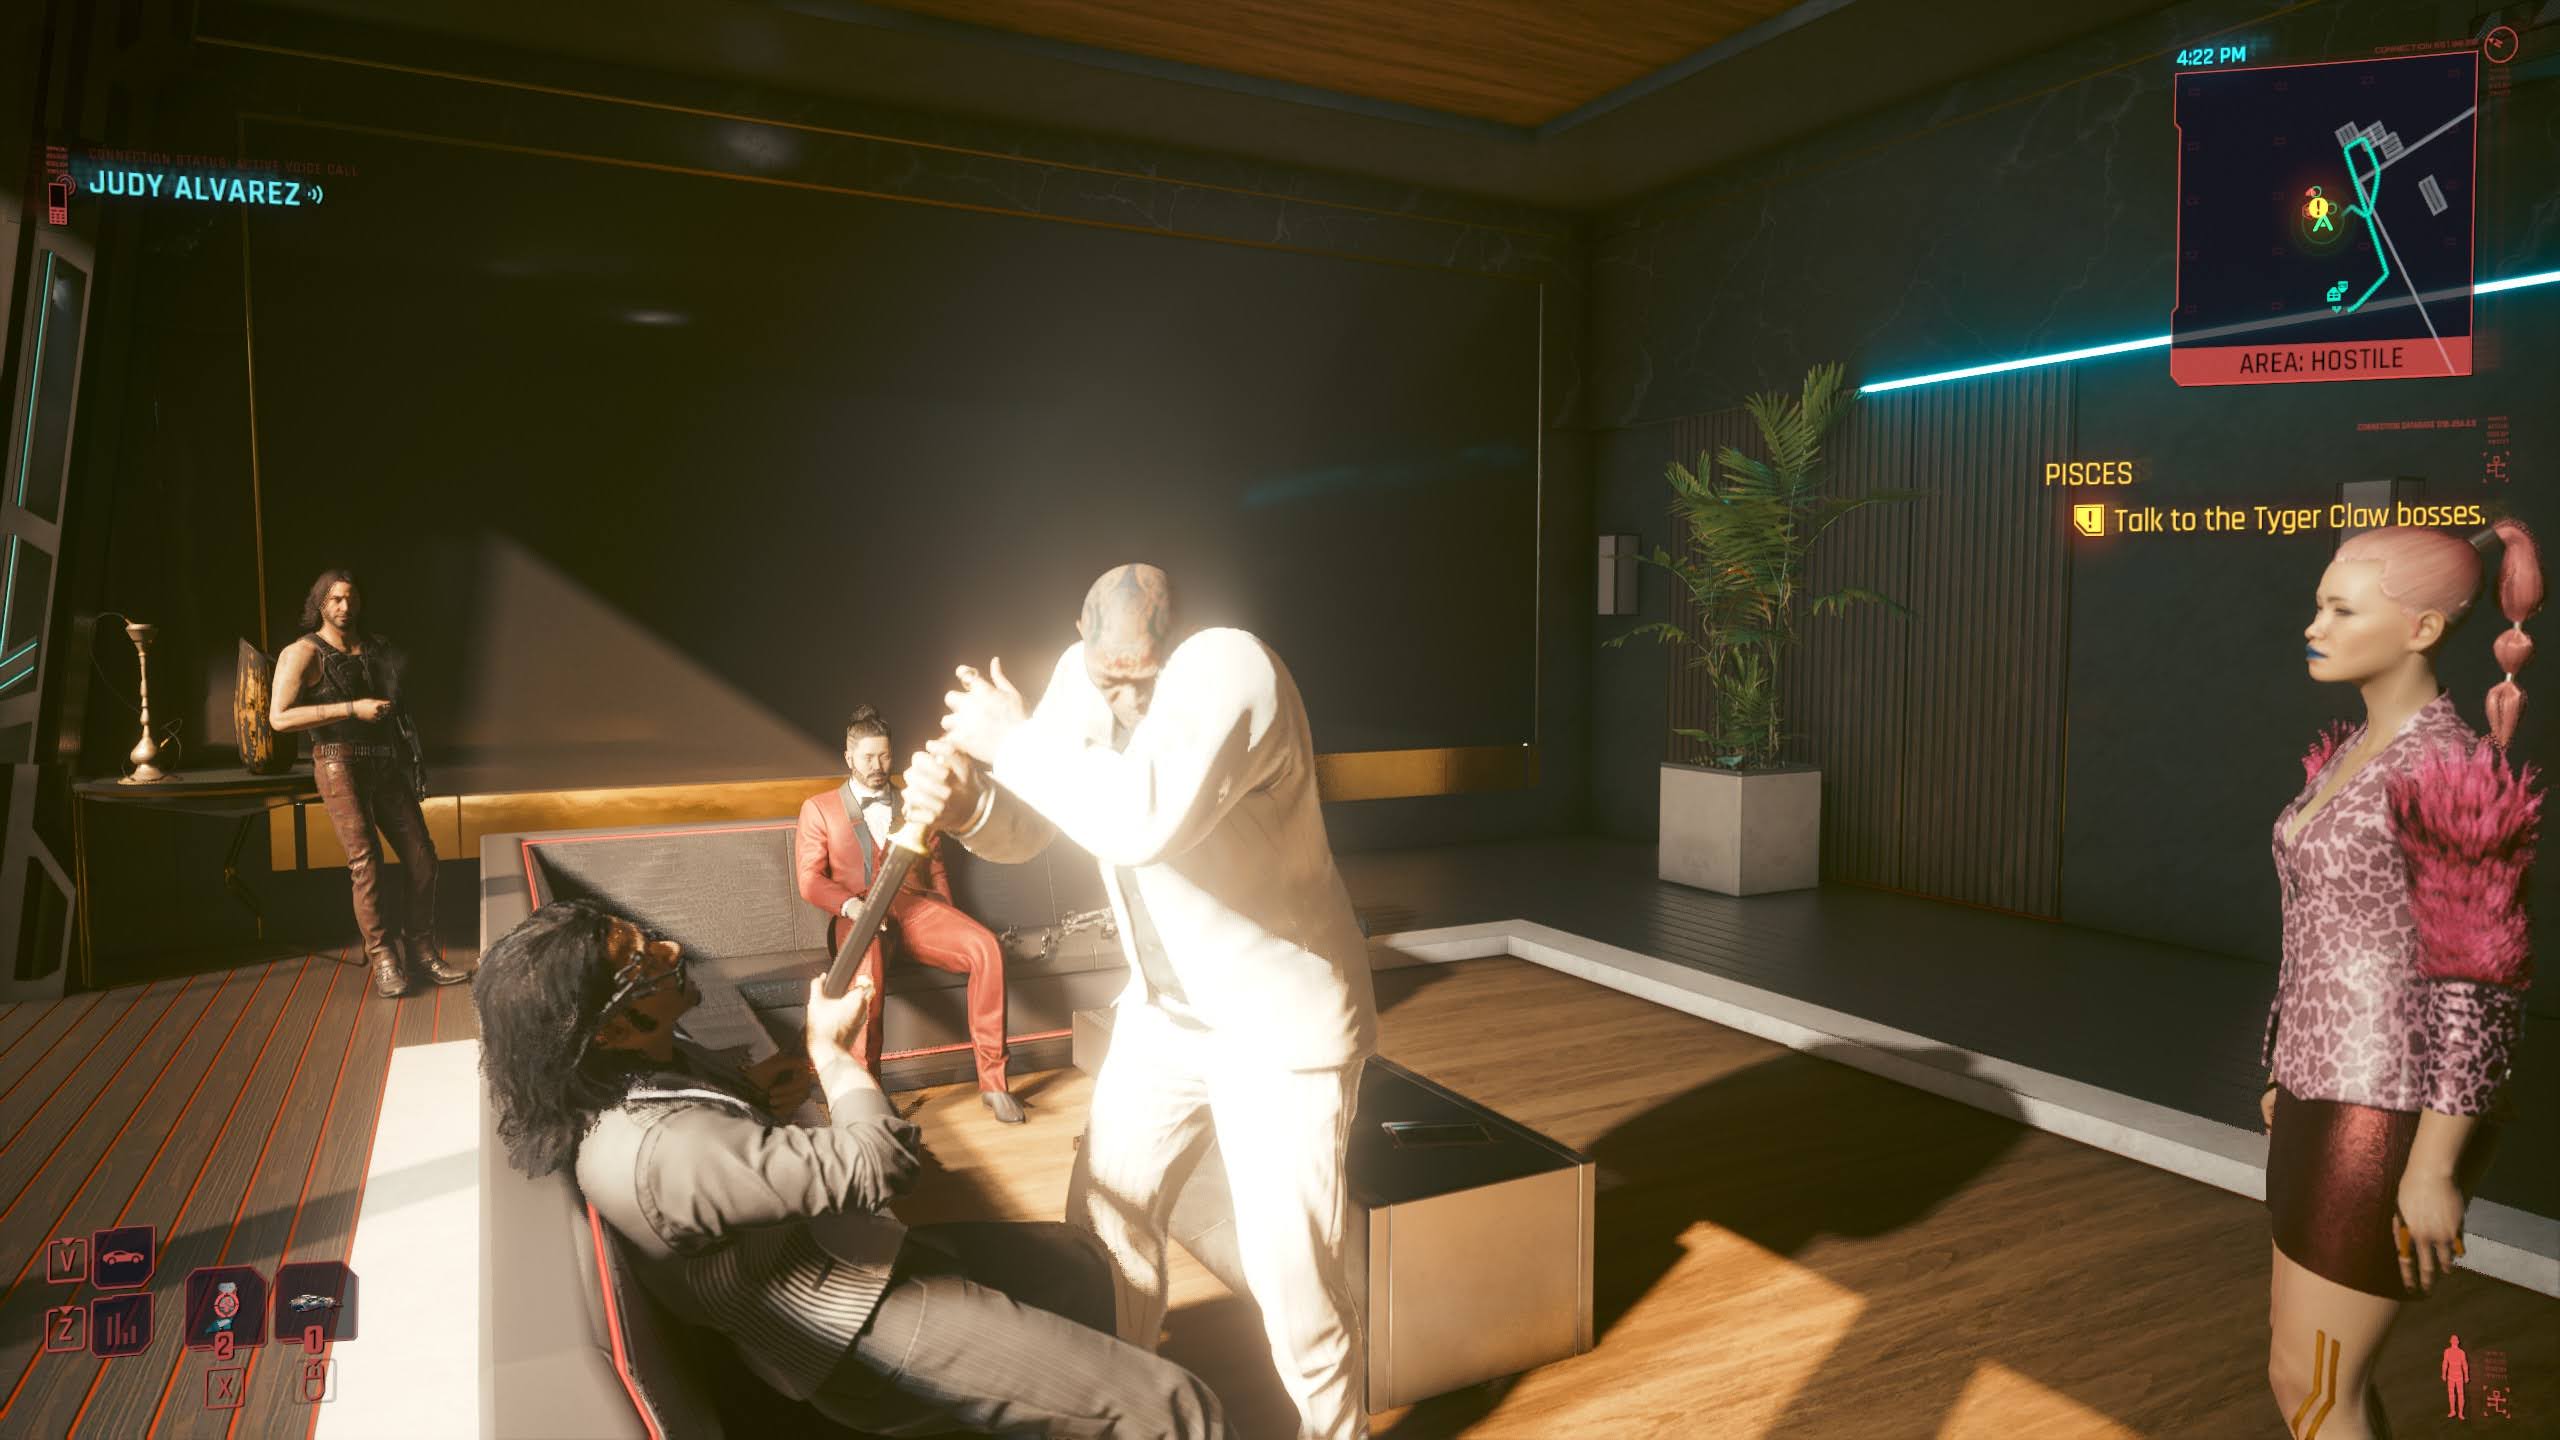
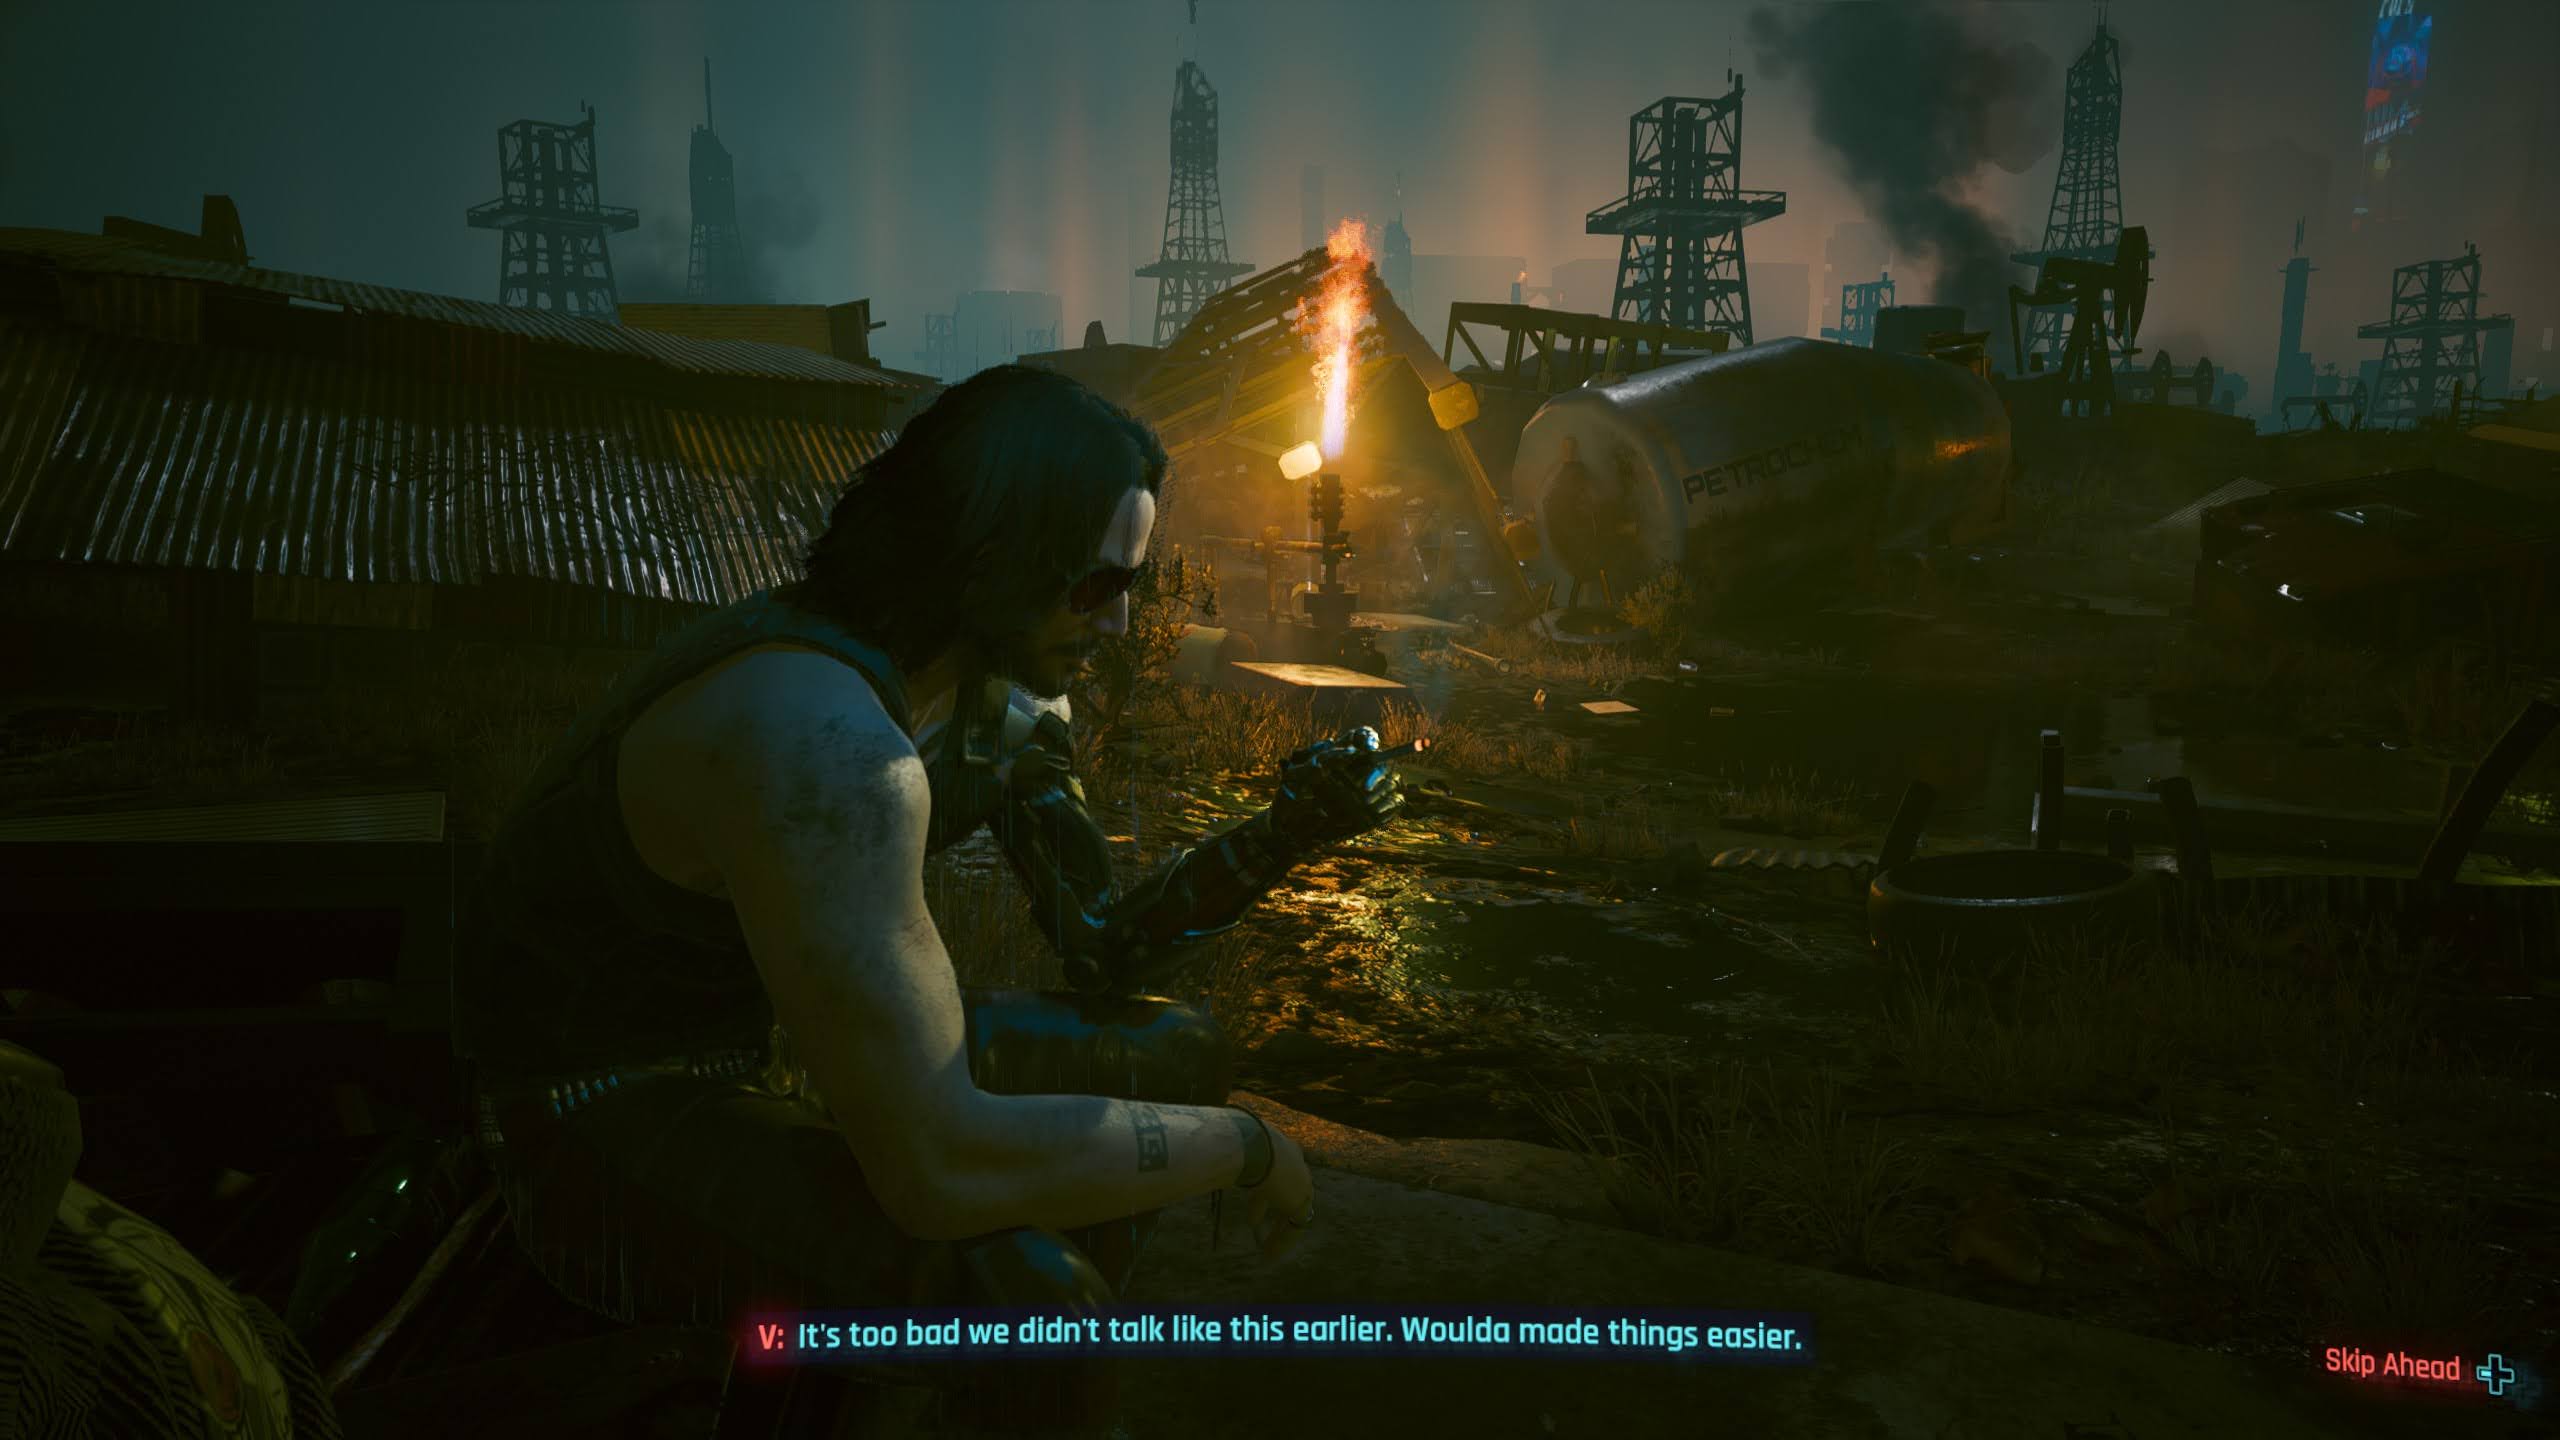
The writing and world-building in this game are on a level I wasn’t prepared for. People call it an FPS or an Action-RPG, but to me, it felt almost like a first-person visual novel. Early in the game, I spent hours just walking. I avoided fast travel because I wanted to soak in the atmosphere—to see the way the light hit the grime and the neon. That slower pace gave me a much deeper appreciation for the game’s thematic exploration of this technological dystopia.
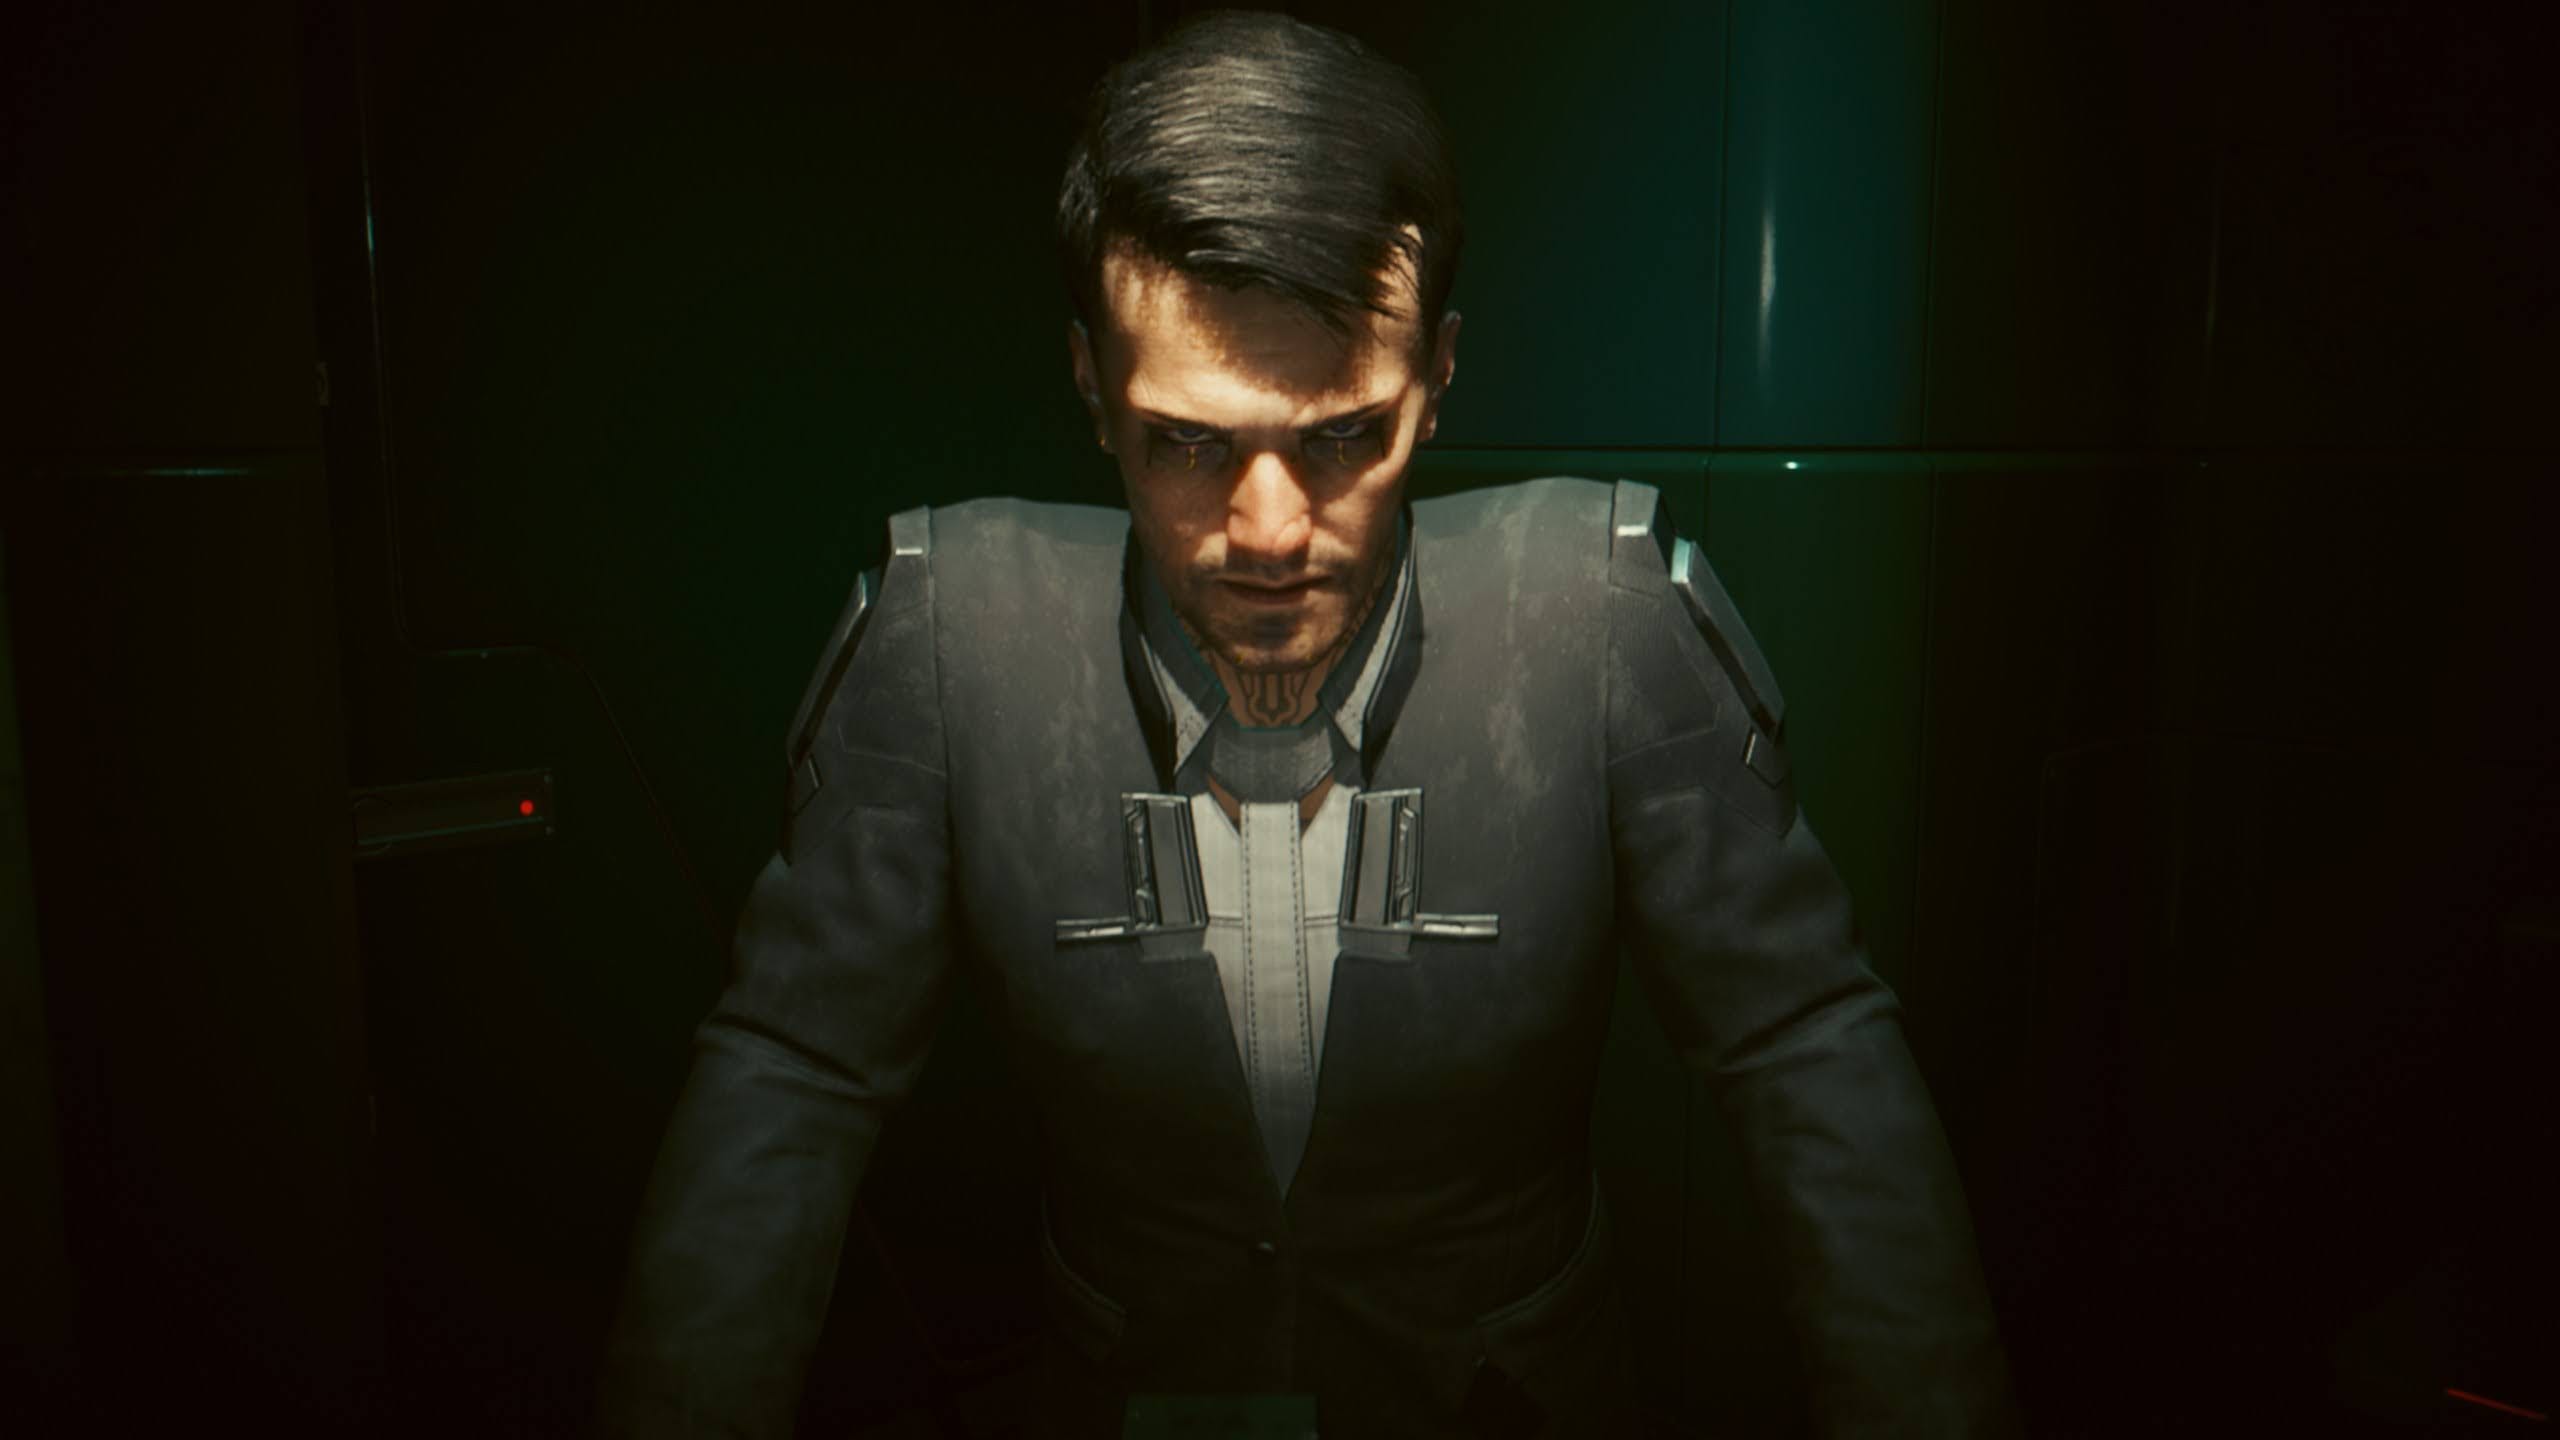
The immersion isn’t just about the rain-slicked streets; it’s in the quiet, uncomfortable moments. The raw themes, the camera angles, the tight close-ups, and the facial features are so detailed that you can actually see and feel the emotions of the person standing in front of you. When a character looks at you with desperation or disappointment, it hits with a weight that most games can’t replicate. You see the constant, suffocating advertisements for products nobody needs, the random NPCs on the street corner struggling with homelessness and violence, while the ultra-rich continue to get ultra…richer. You don’t just see the inequality; you breathe it in, you feel it.

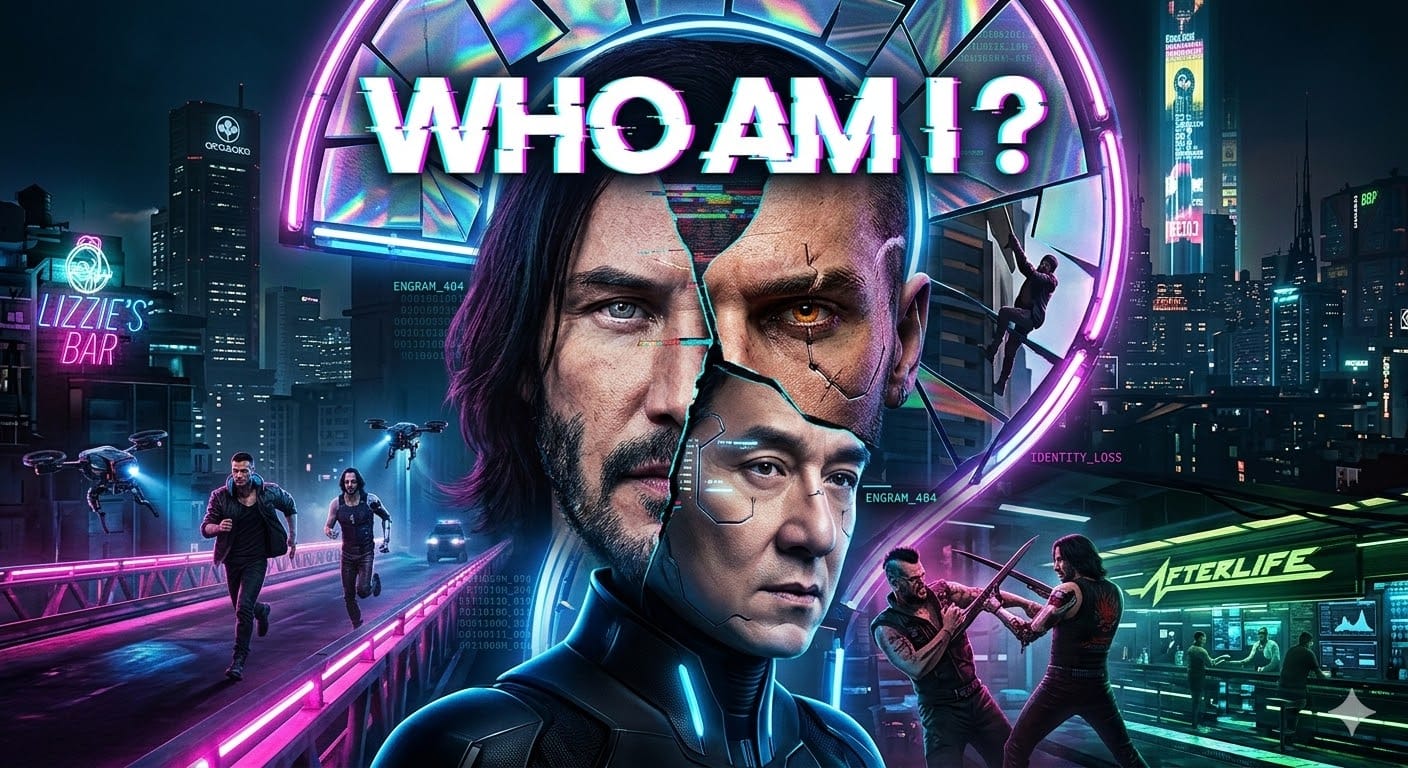
III. The War of Identity: Who Am I Playing?
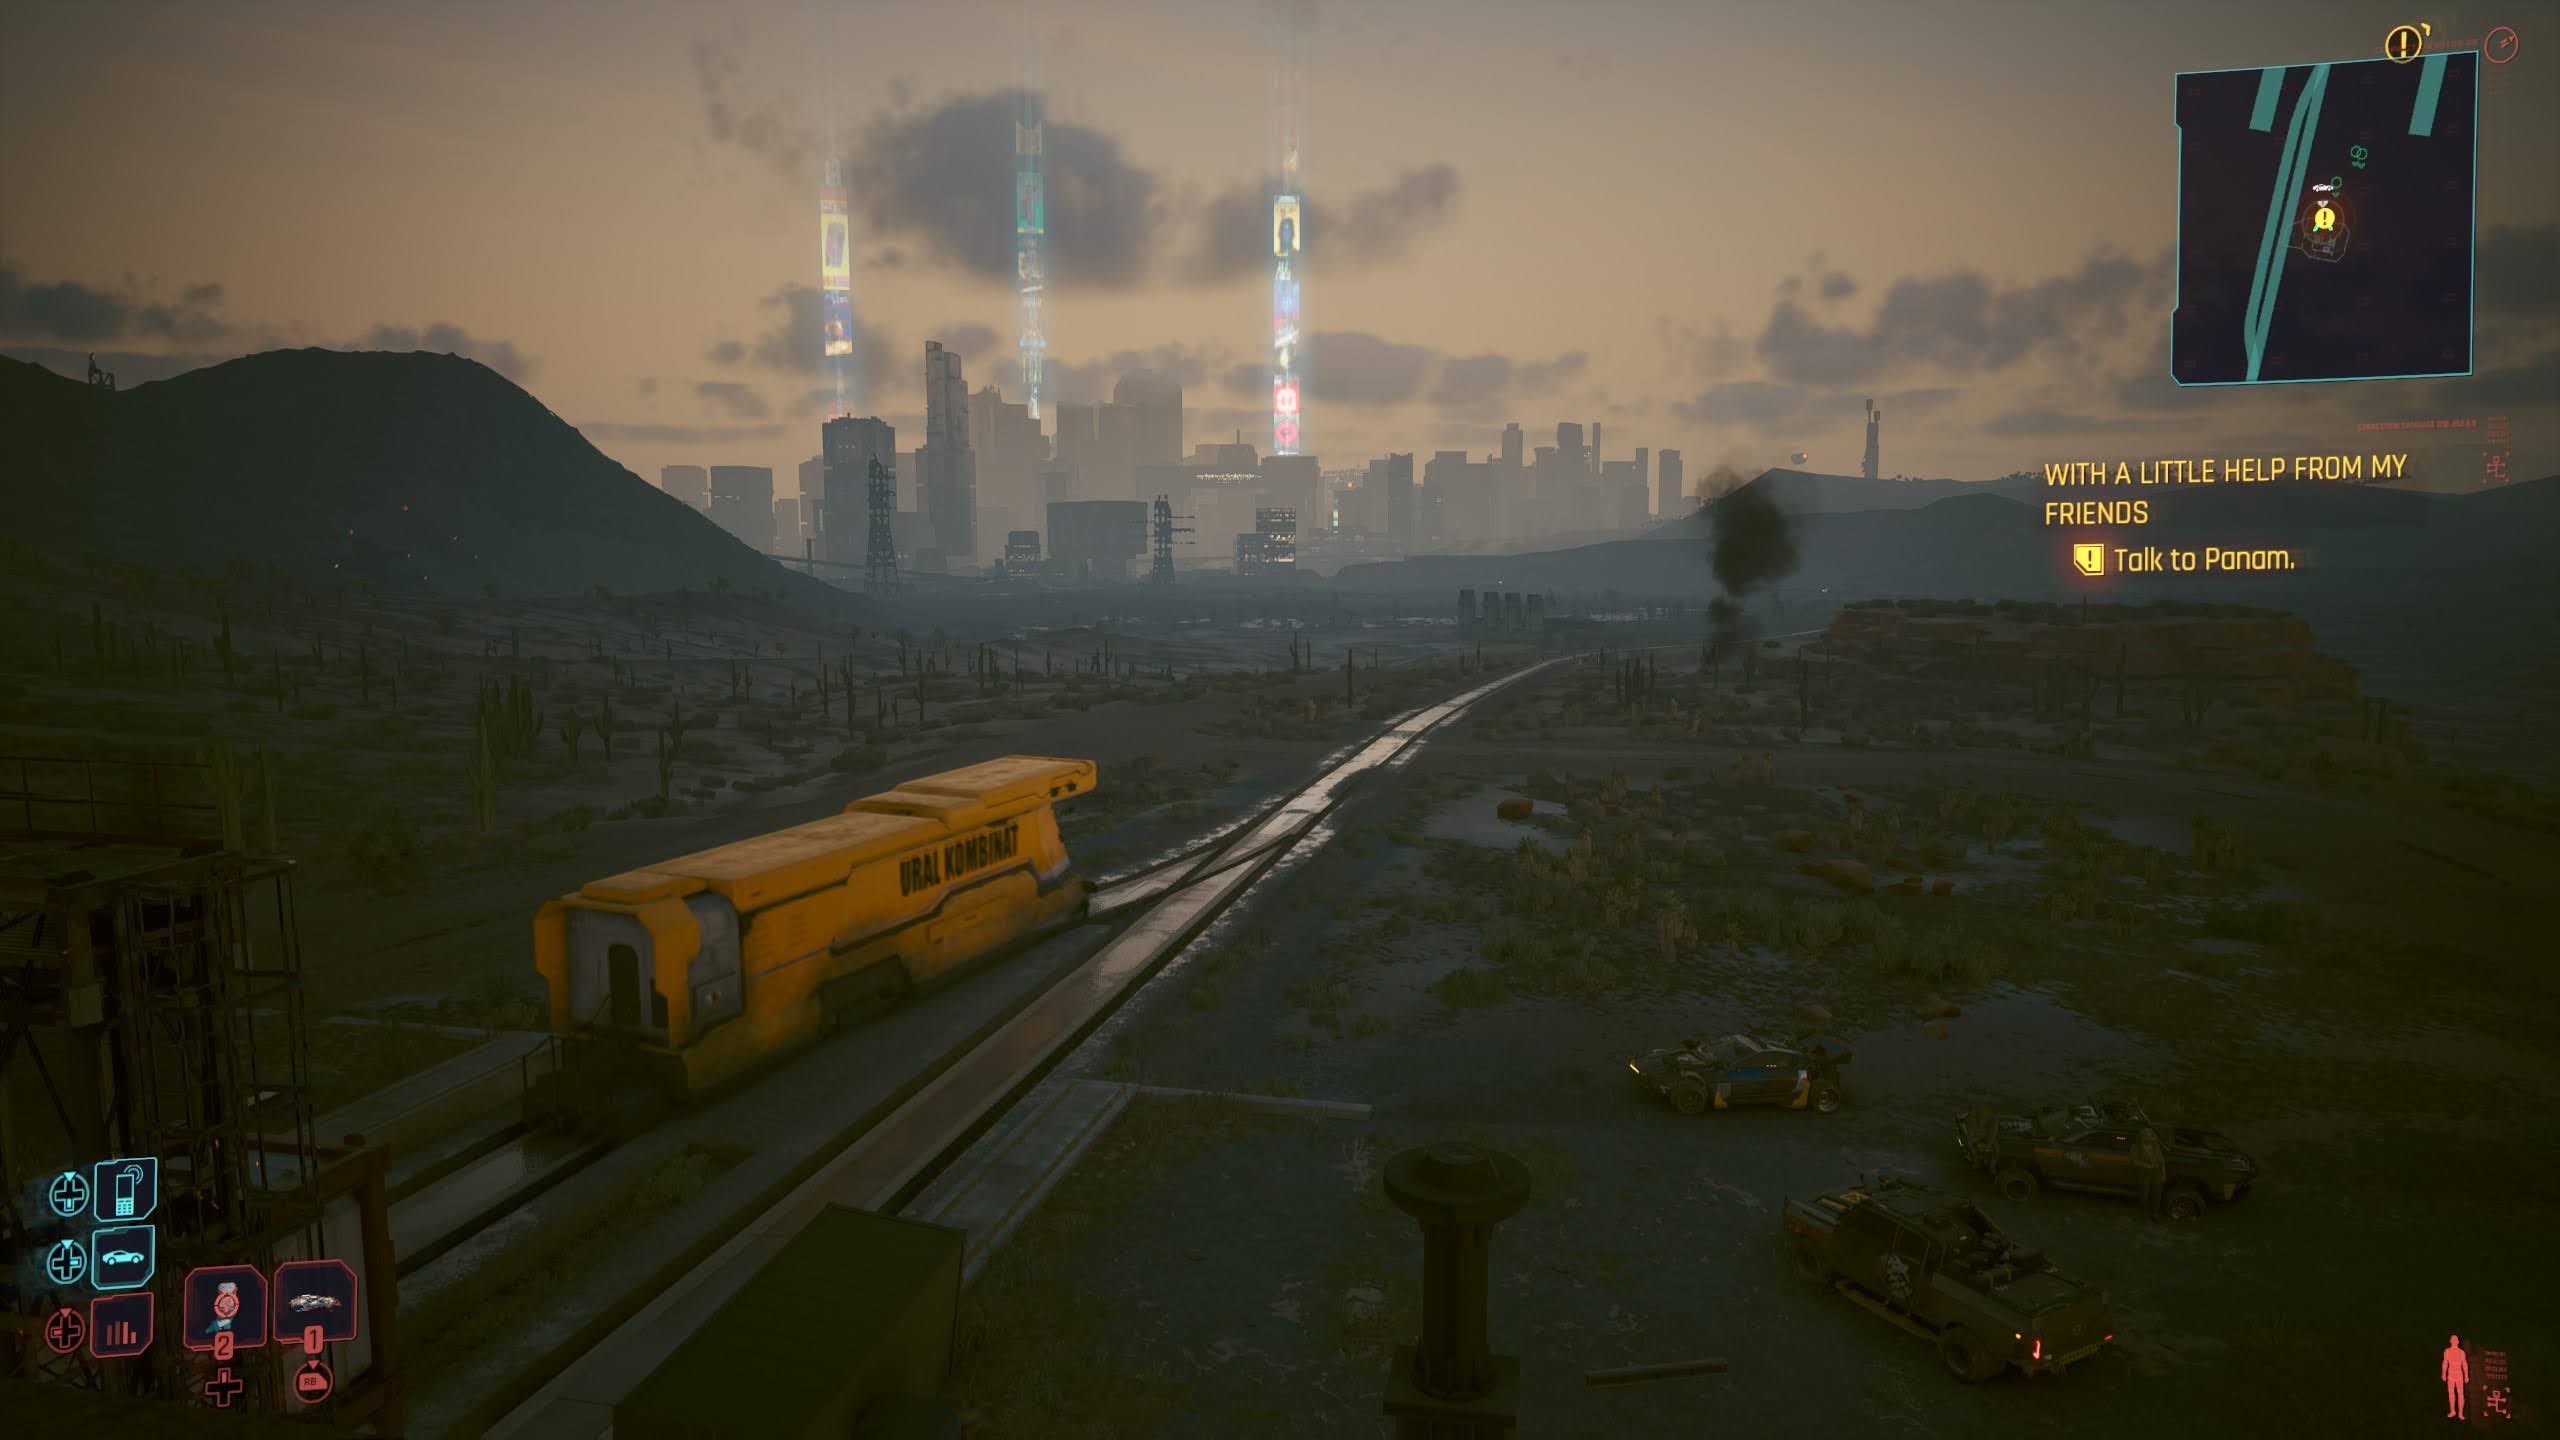
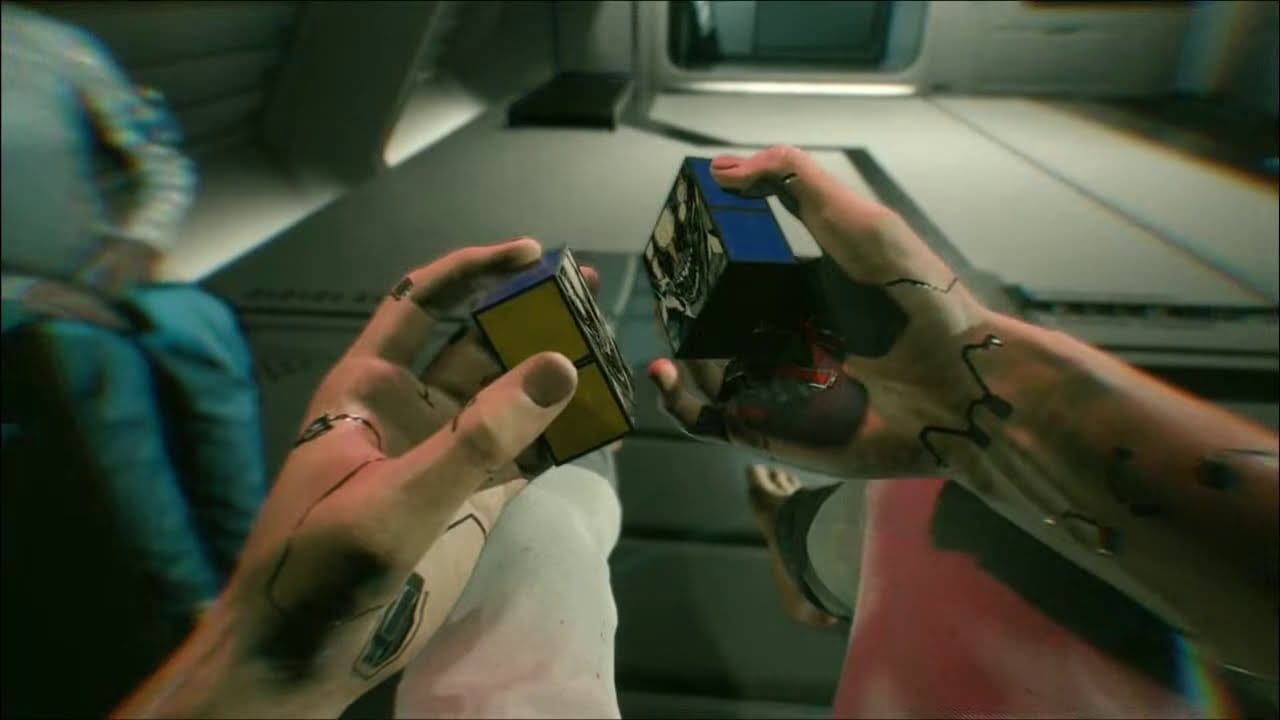
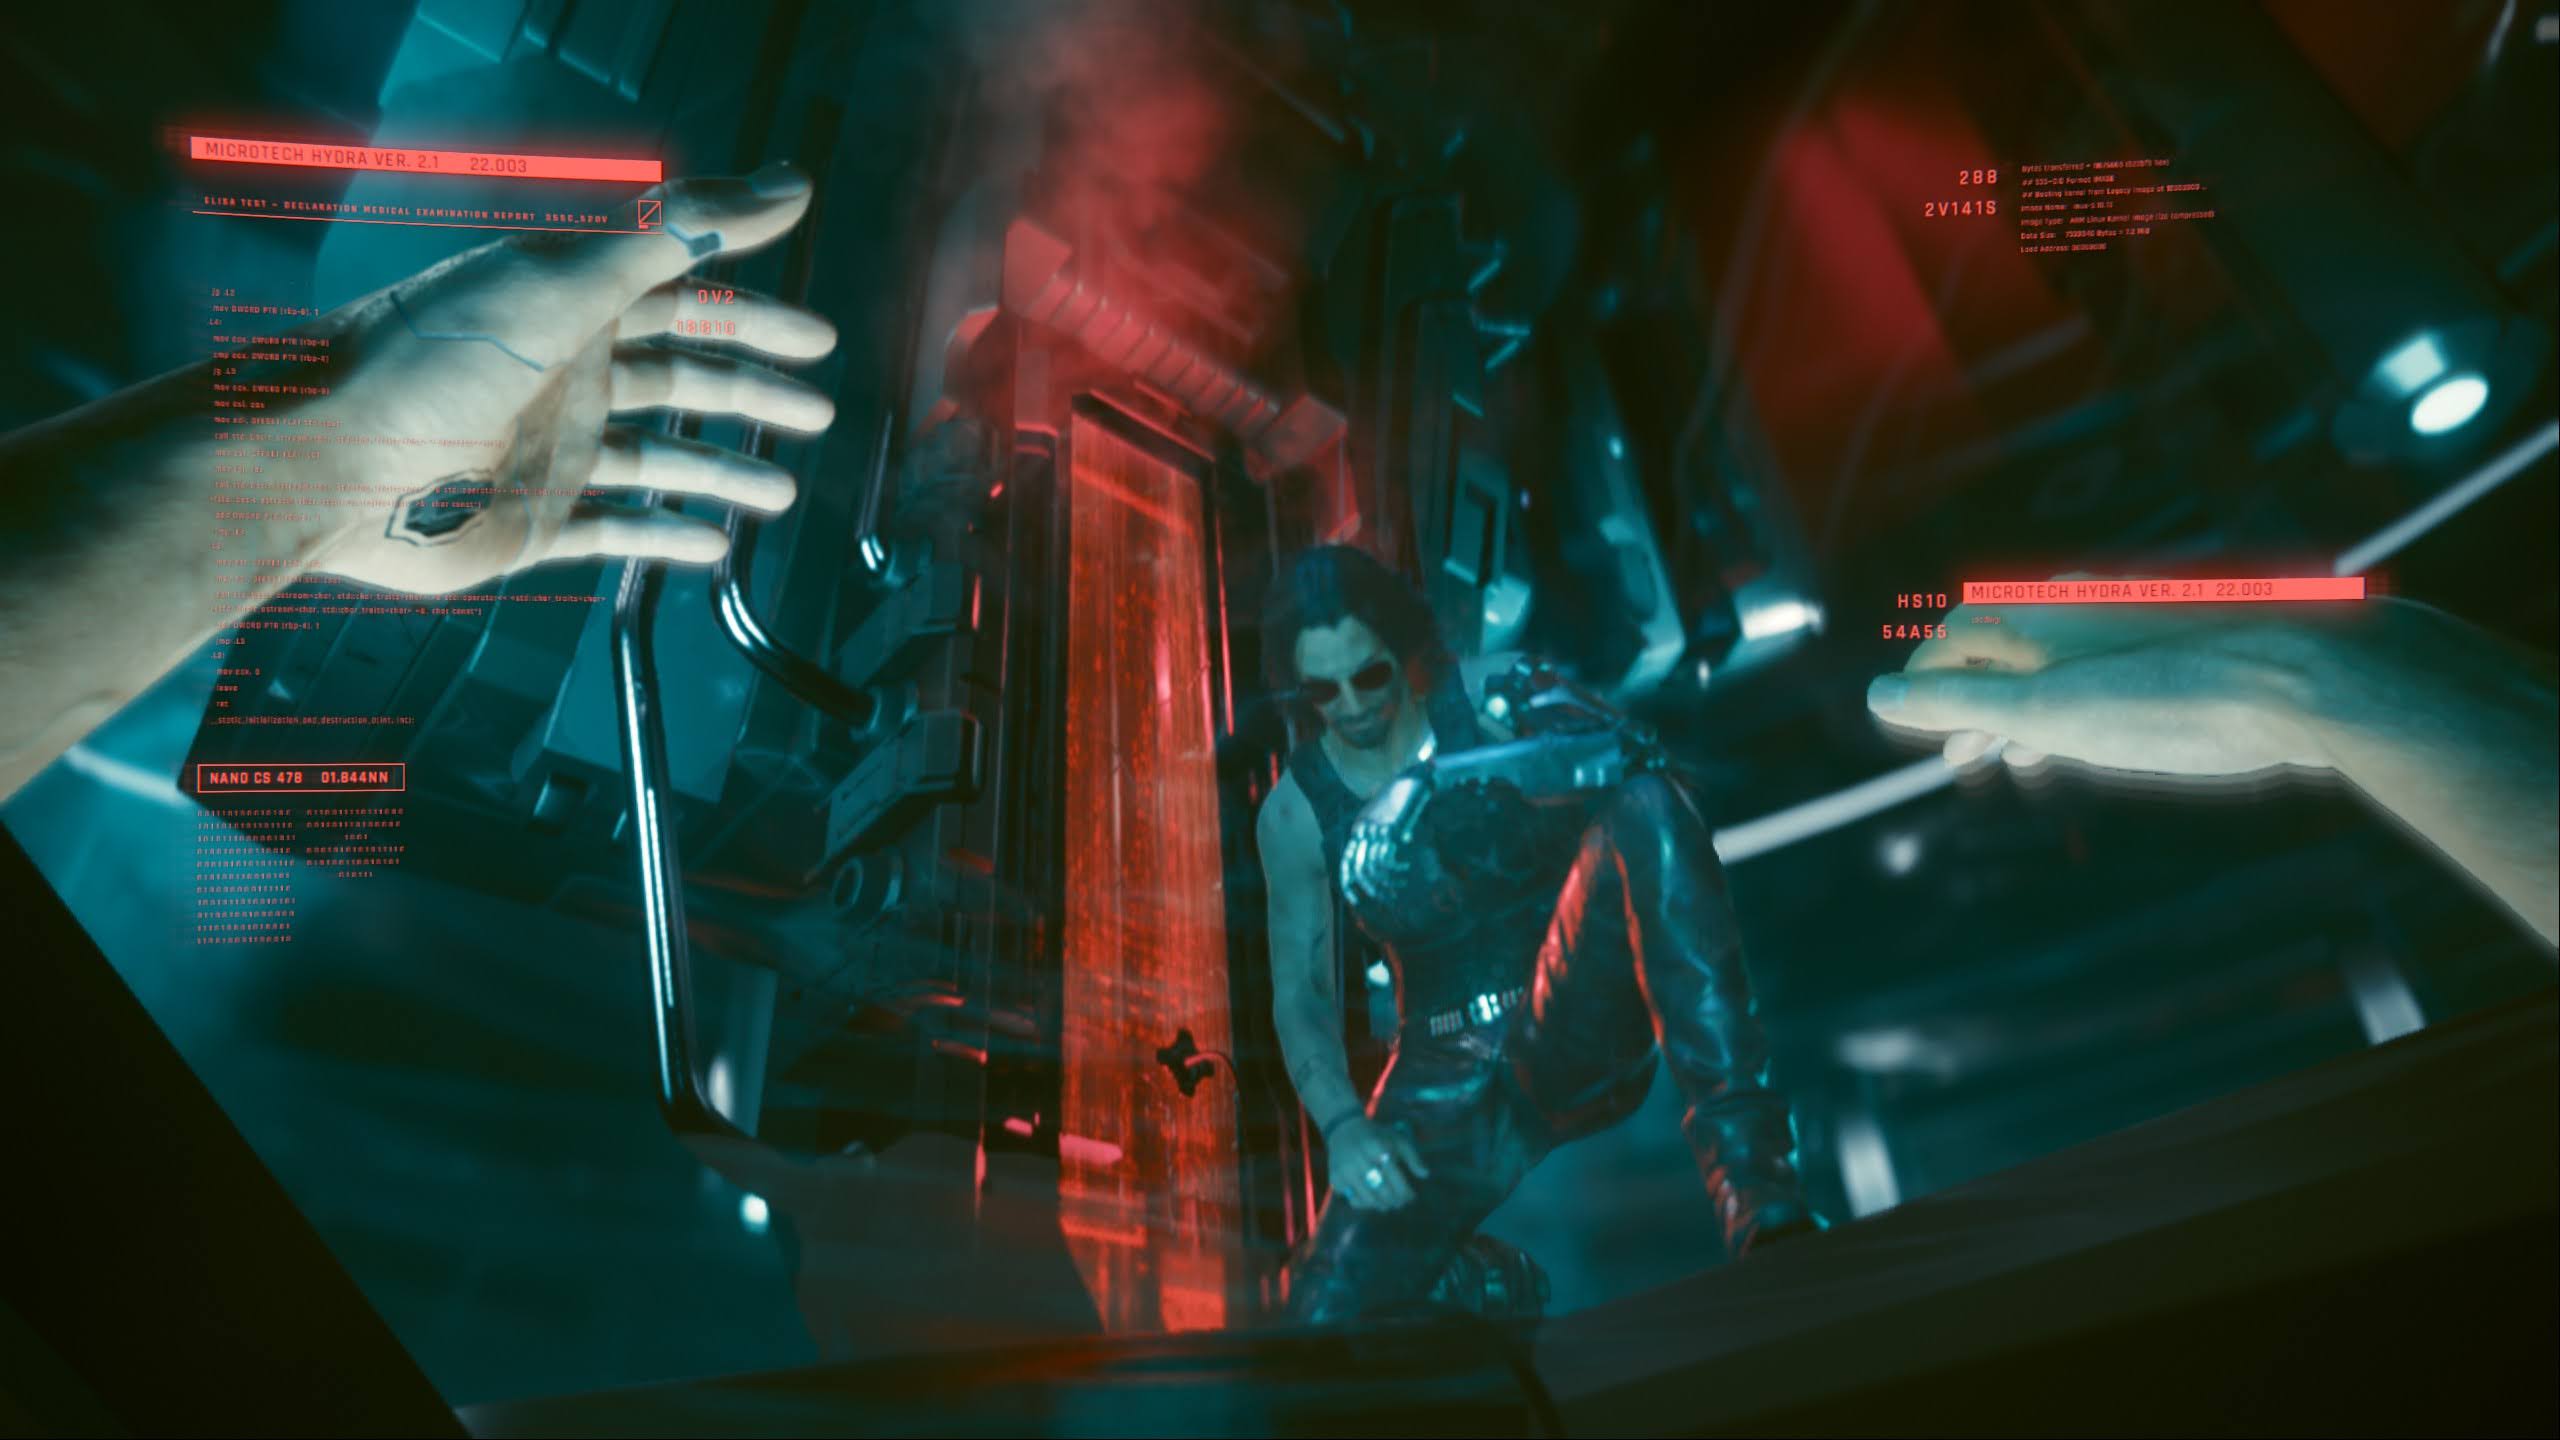
This led me to my final, defining decision. When it came down to the wire, I chose to go solo. I didn’t want to drag Panam and Rogue into a bloodbath for my sake. I didn’t want to let Johnny take over. I decided to work with Hanako Arasaka directly. At the time, it felt like the most “Ross” thing to do: a pragmatic, calculated risk to secure my own survival. I thought, “This is my life, and I am choosing to fight for it on my own terms.” But as the mission progressed, the feeling shifted. “You pick the cards to your own destiny, and I had drawn the Devil.”
IV. The Romance Misstep: I Thought I was a Genius!
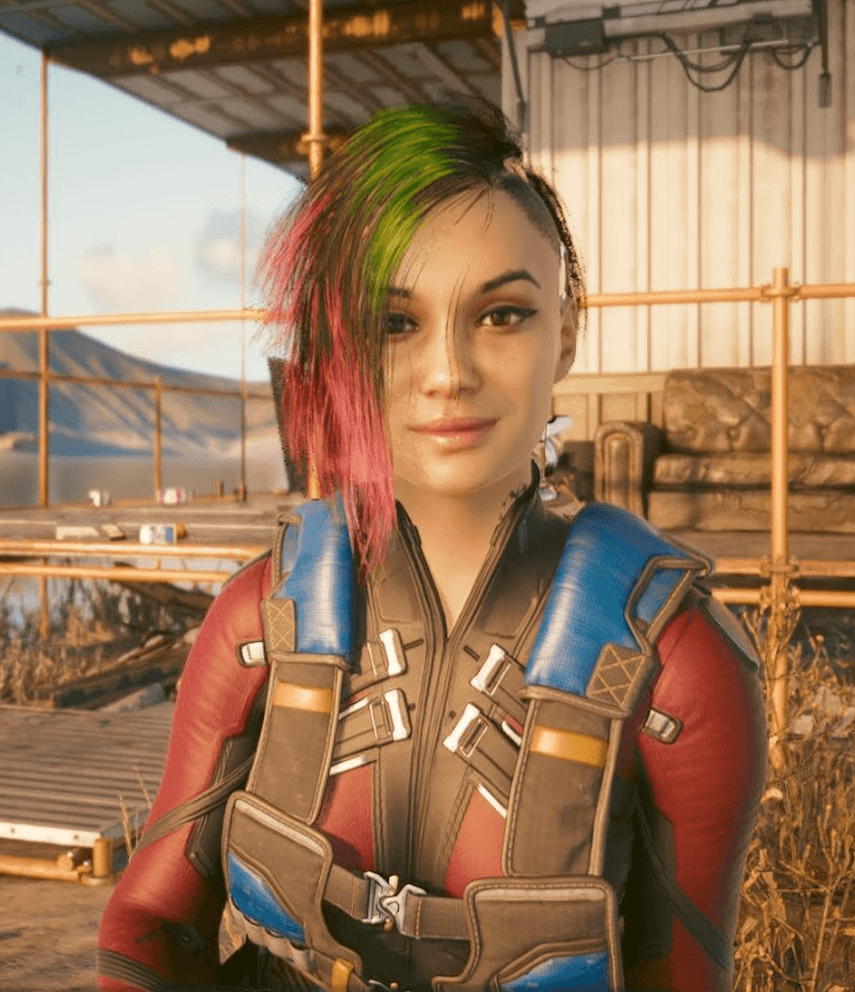
On a lighter note, I went into this thinking it would be like the Witcher 3—pick between a couple of main options or end up alone. I focused all my attention on Judy, thinking I was making progress. I was a genius…
It was an amusing, if not disappointing, realization that no matter how much effort I put in, I could never change the outcome. I didn’t know at the start of the game that by picking a male character – I had already hard-coded my failure in that specific scenario. In Night City, some doors are locked before you even know they exist and you end up outside without even a doll or a braindance for comfort…
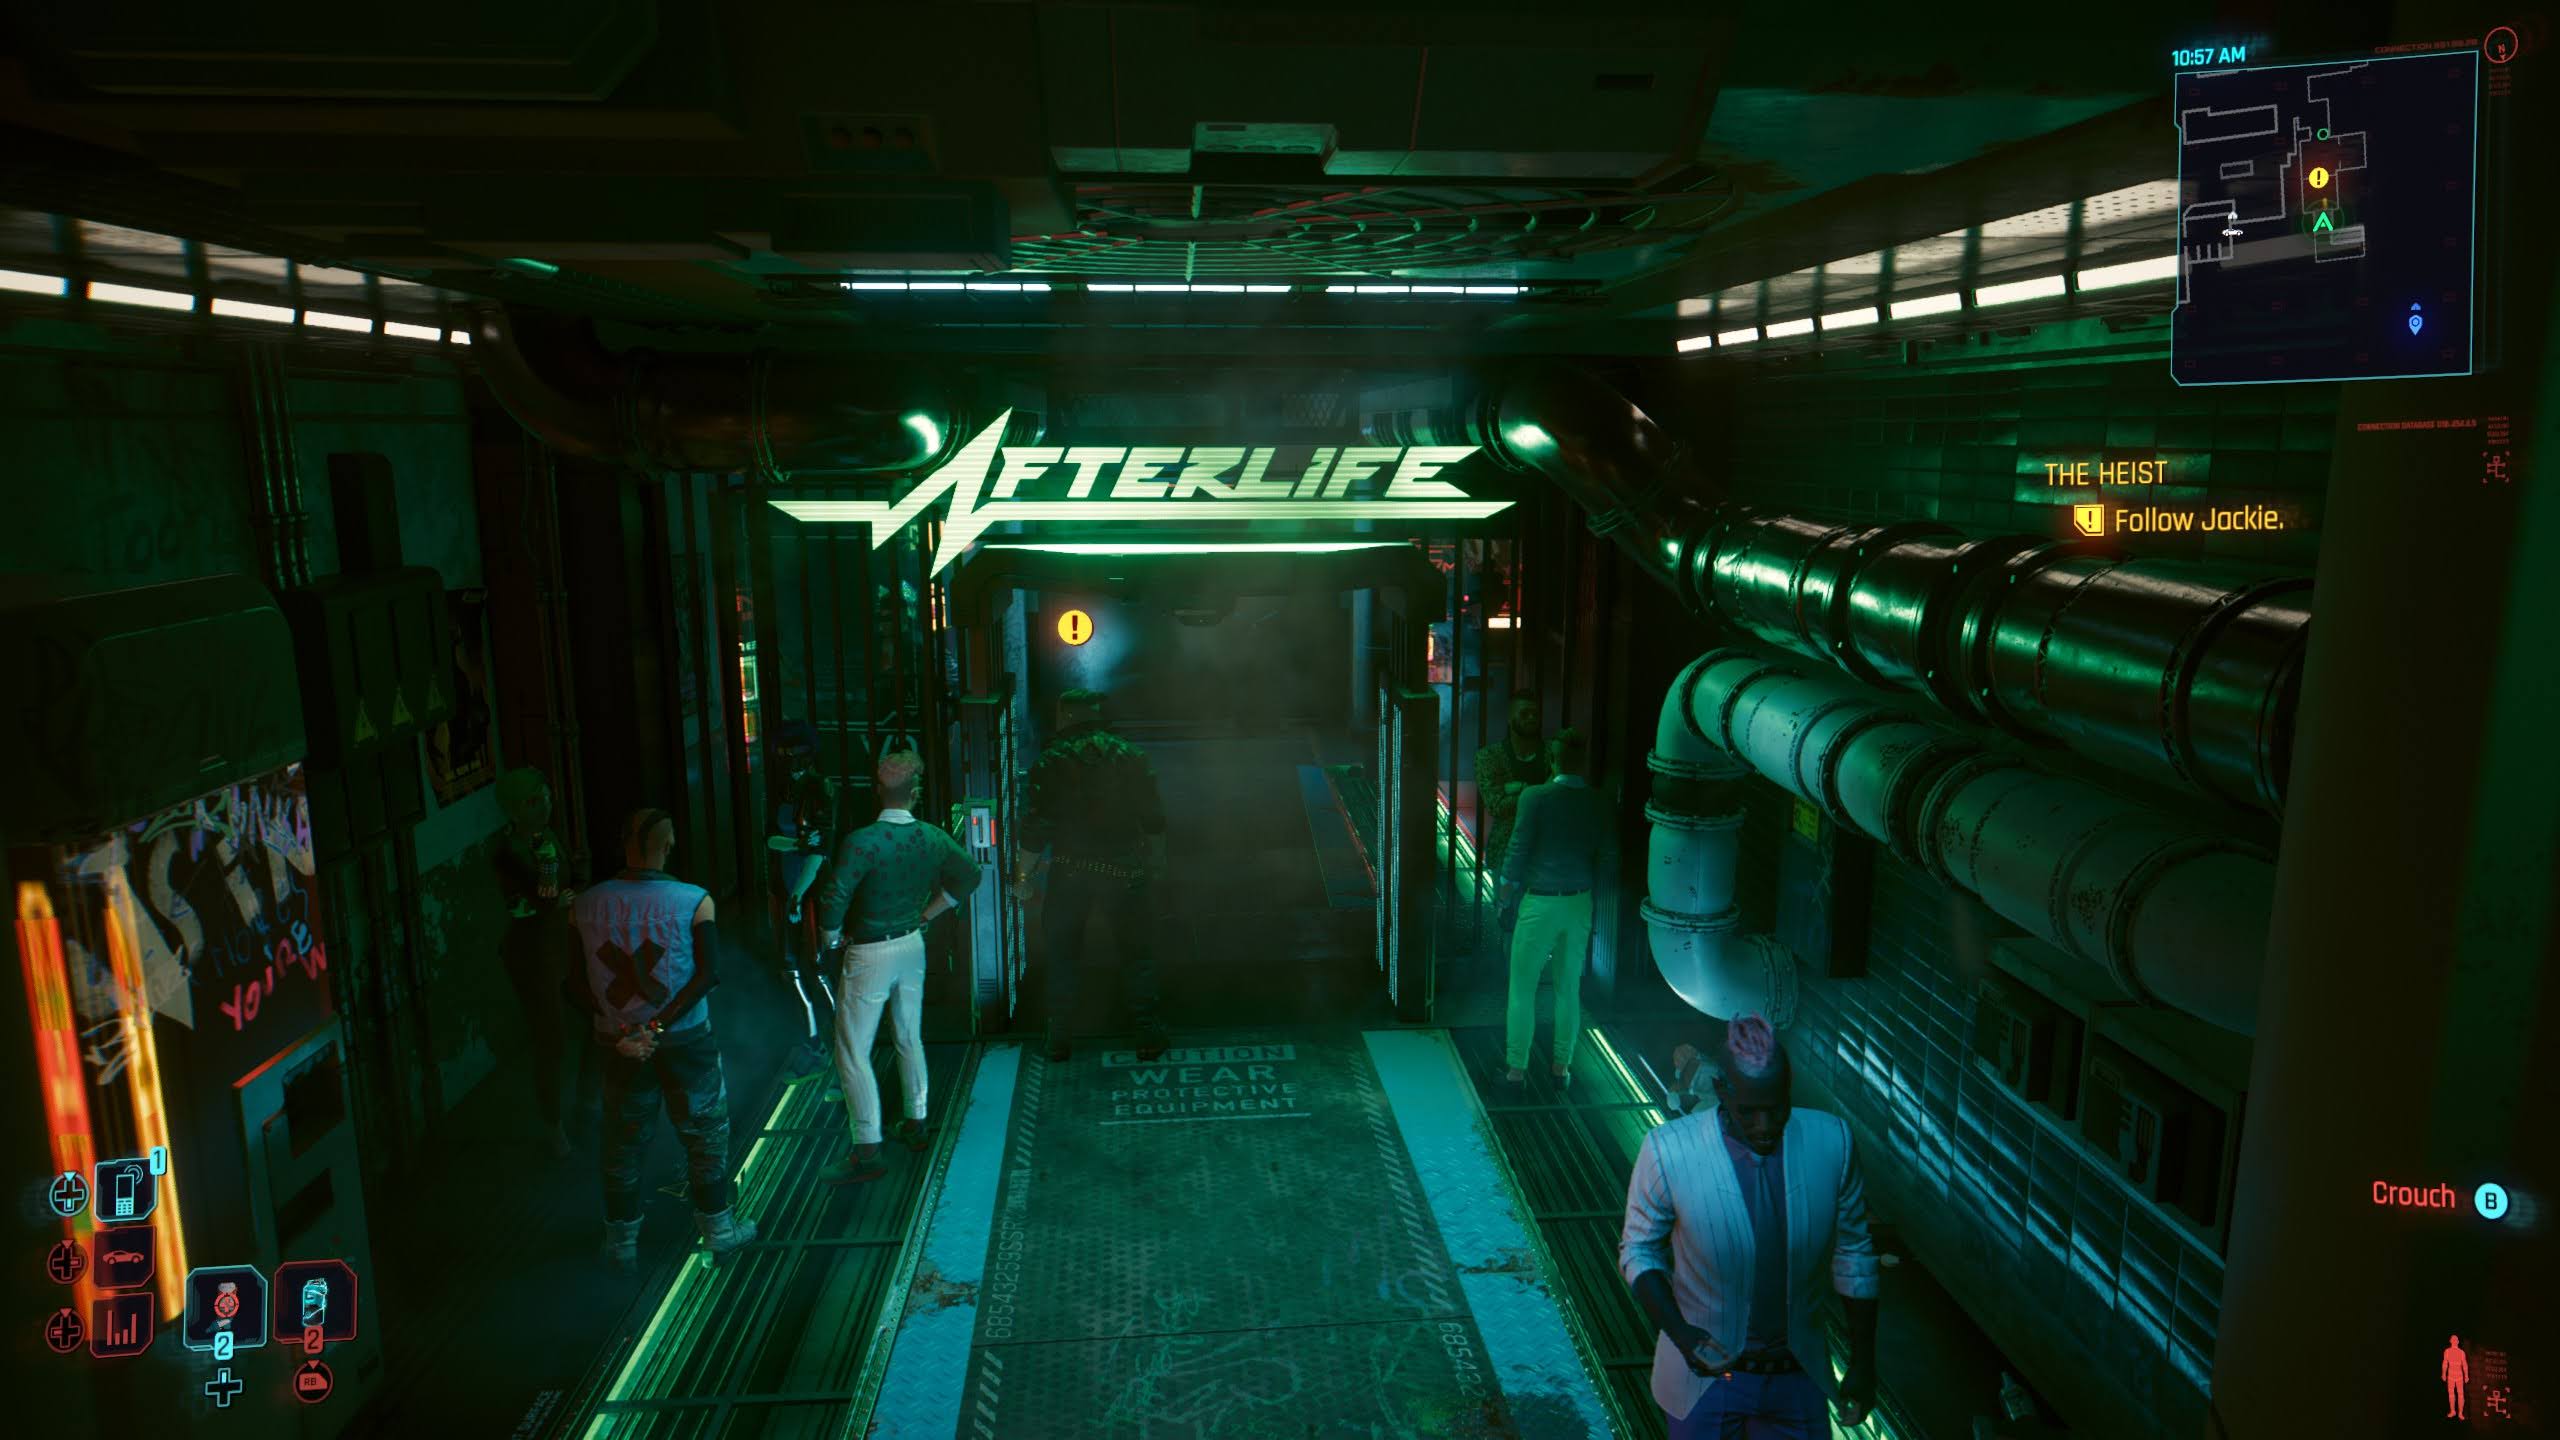
“Sorry, V. I think there’s a glitch in your optics. You’re looking for a romance quest, but I’m strictly a ‘girls-only’ club. Maybe try your luck at the Afterlife?”
V. My Personal Crisis Caused by a Digital Ghost
The final act of the game was a slow-motion car crash for my conscience. Every line of dialogue that crossed the screen felt like I was sinking deeper and deeper into a decision I knew I was going to regret. But there was nothing I could do to change it. I had committed.
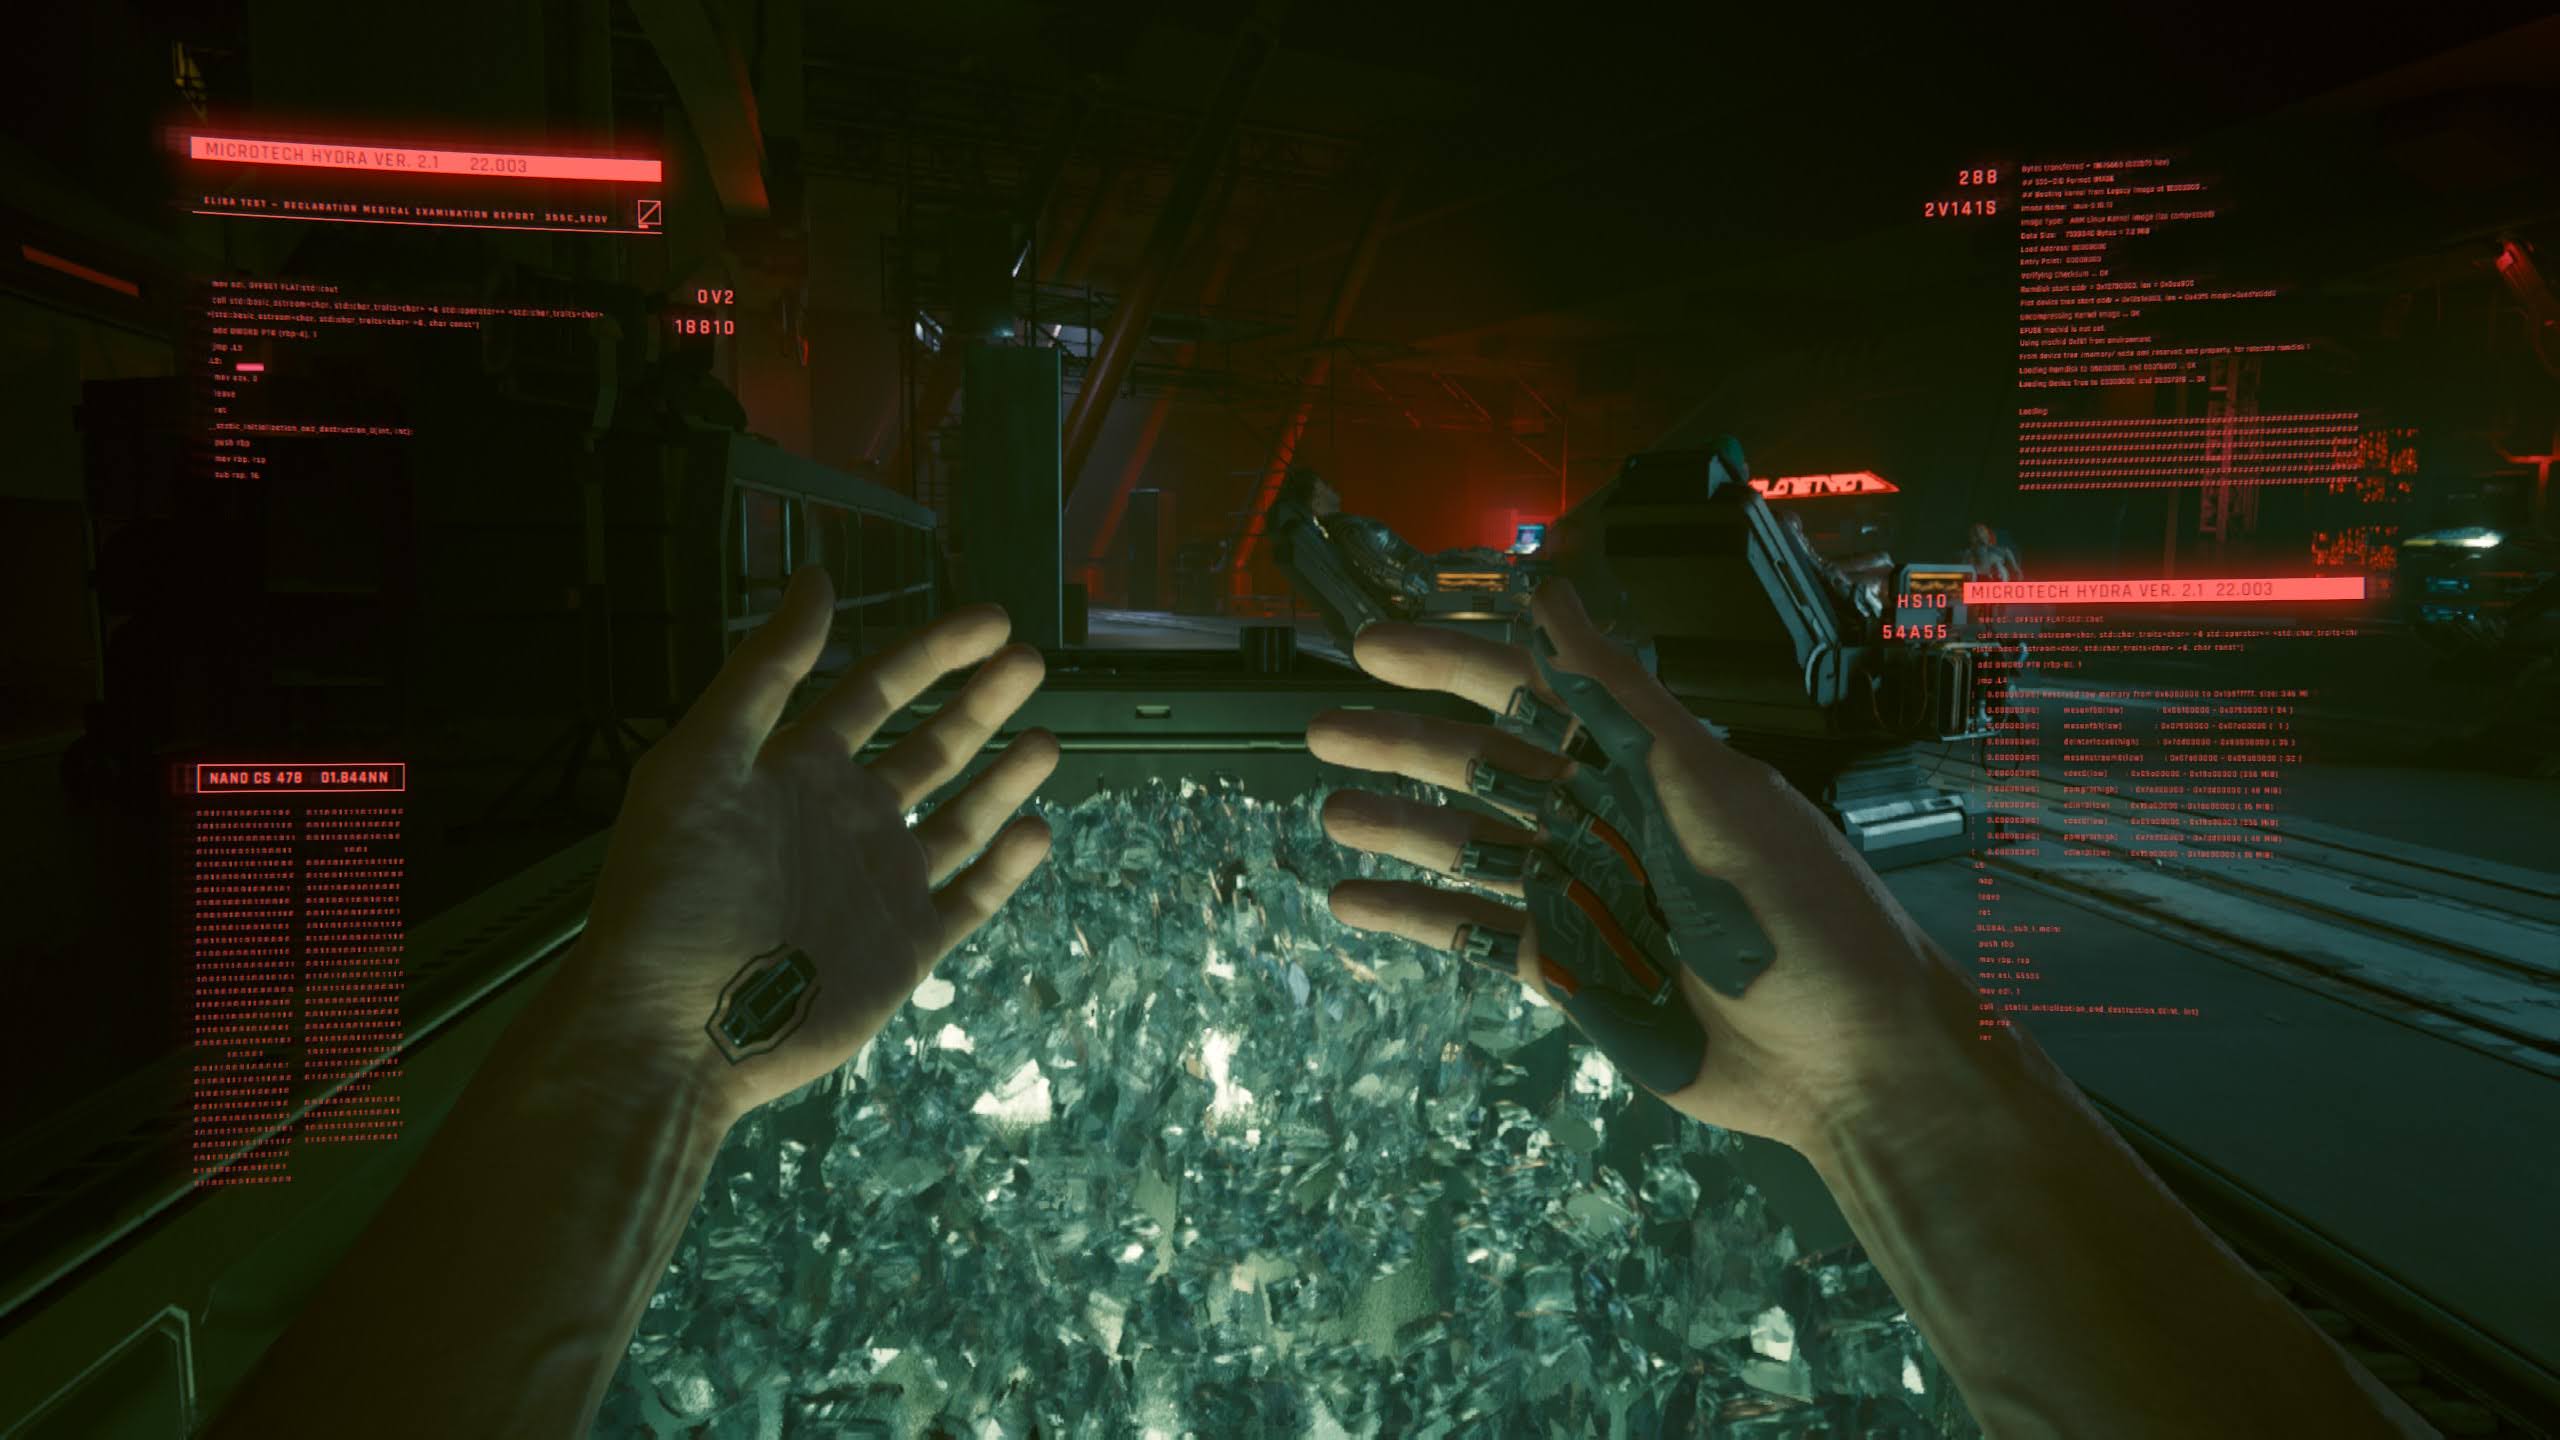
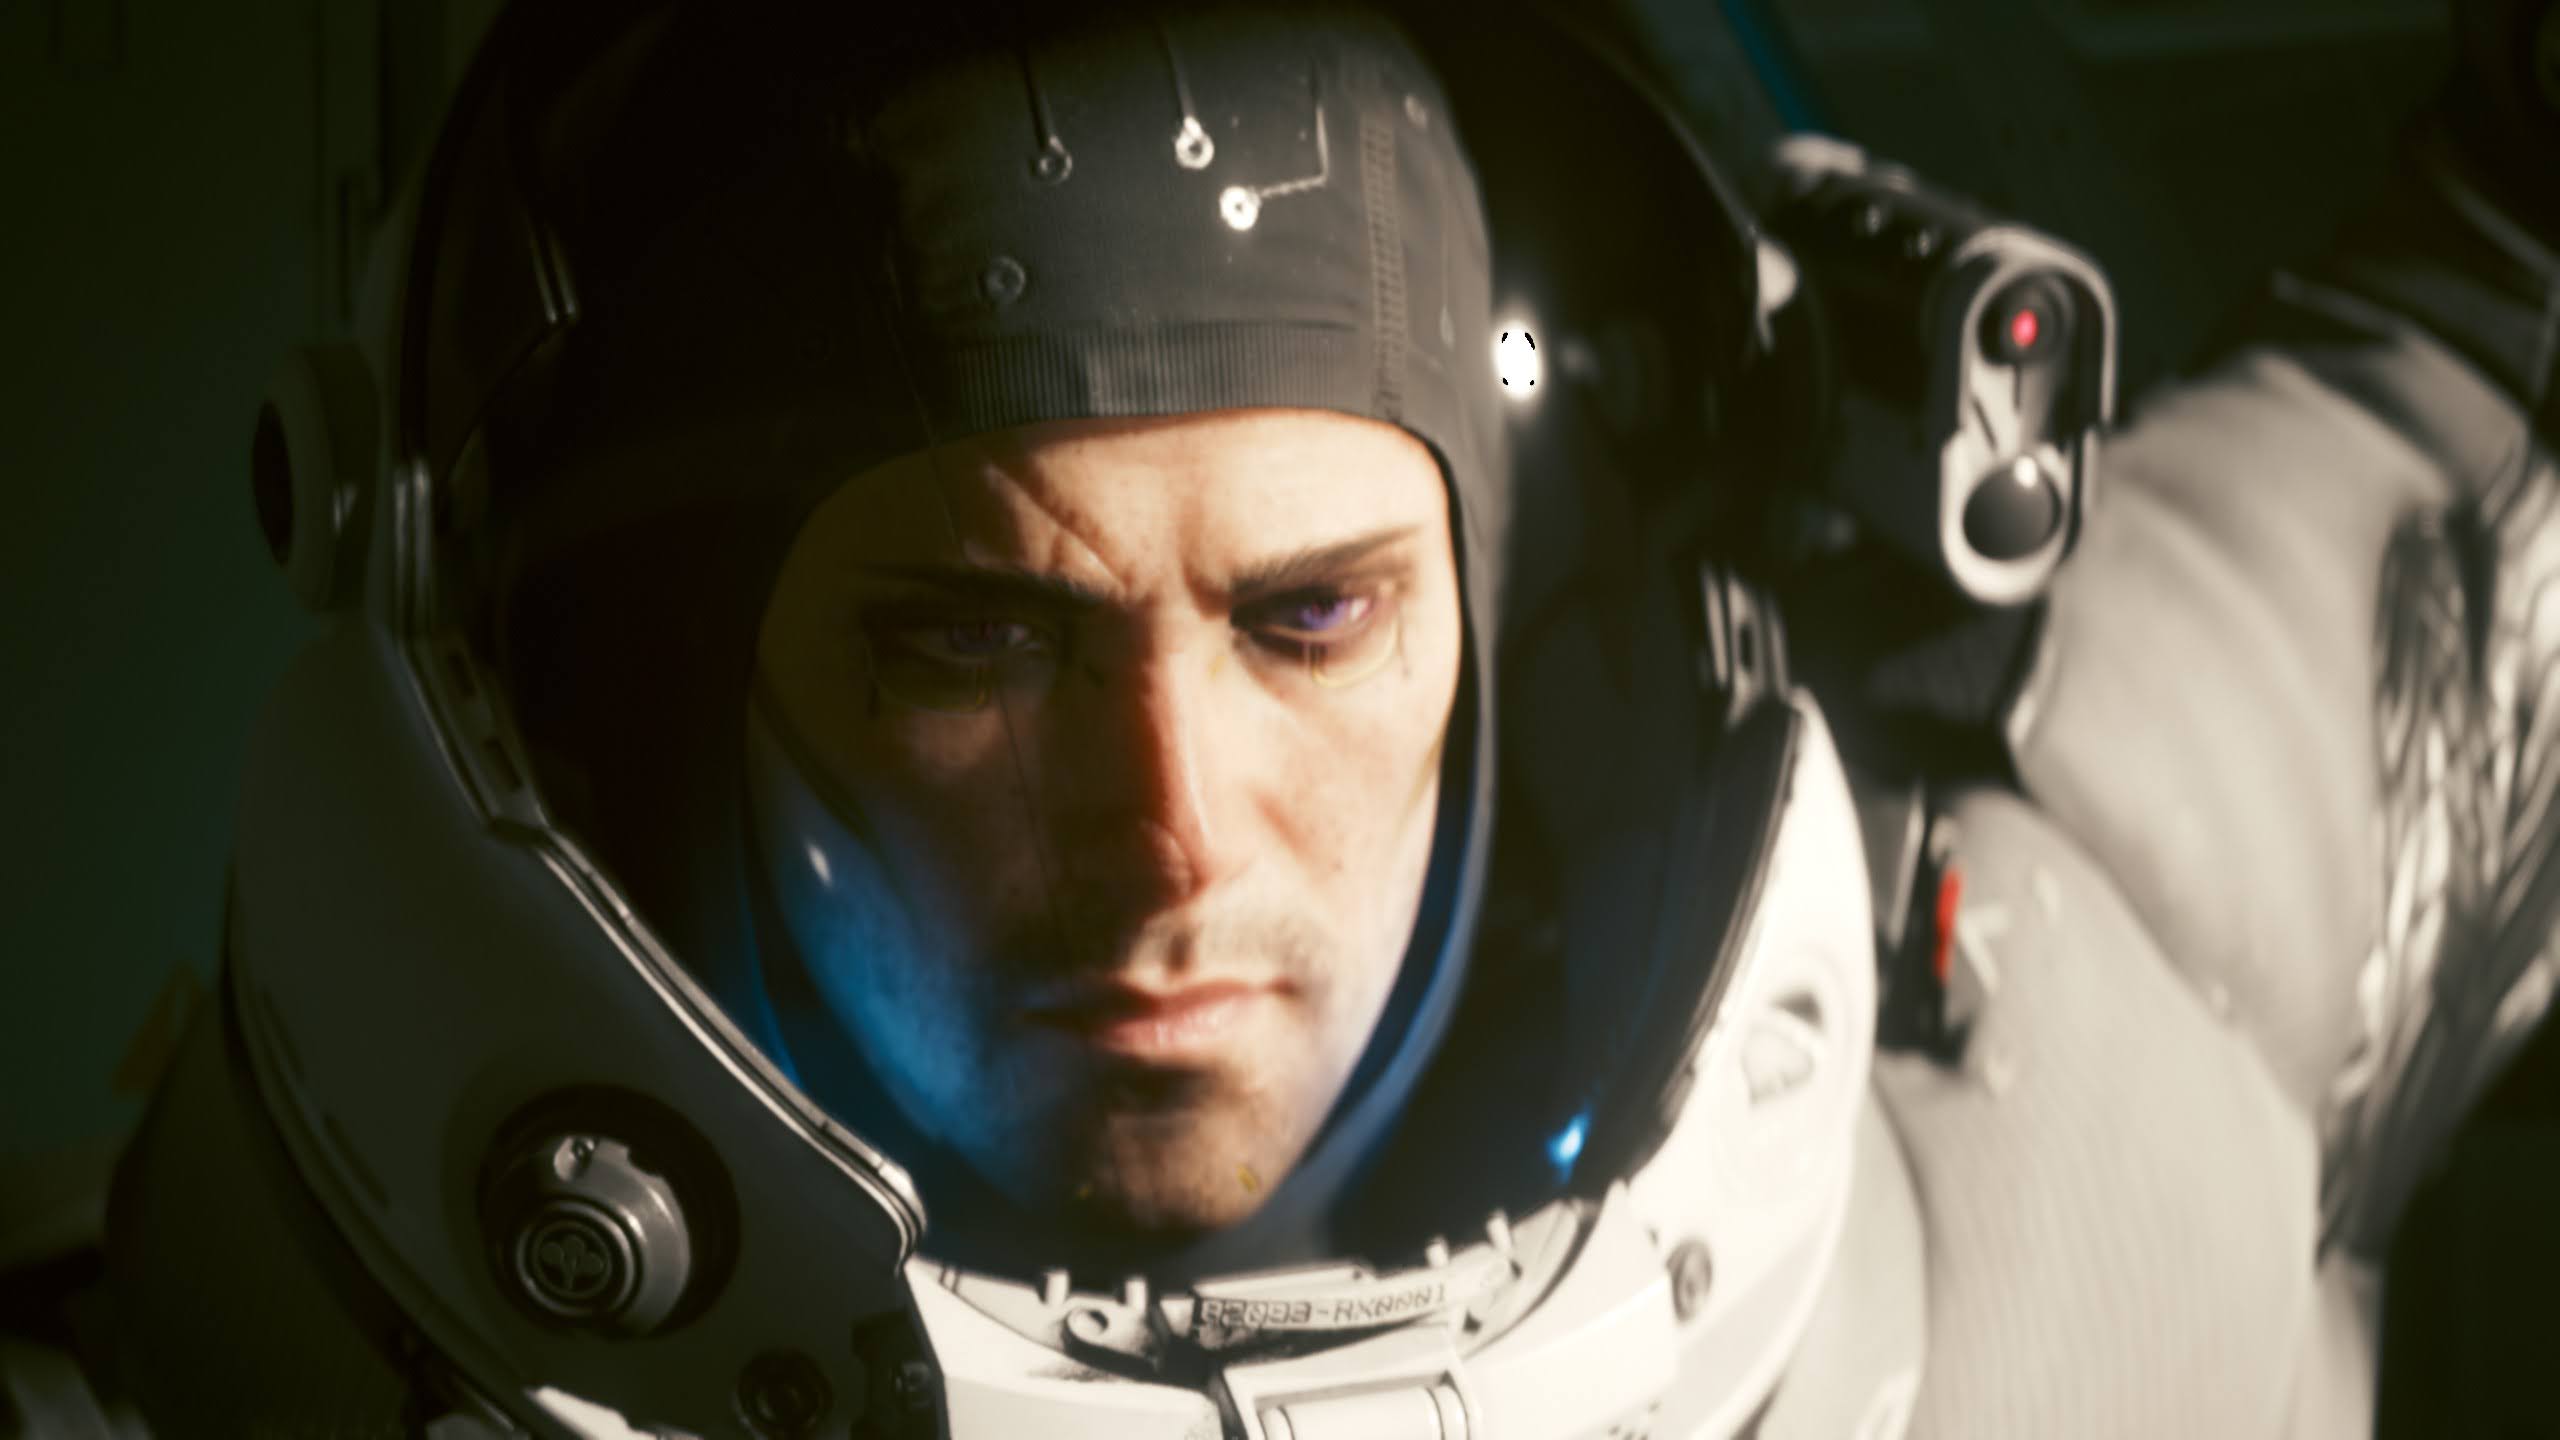
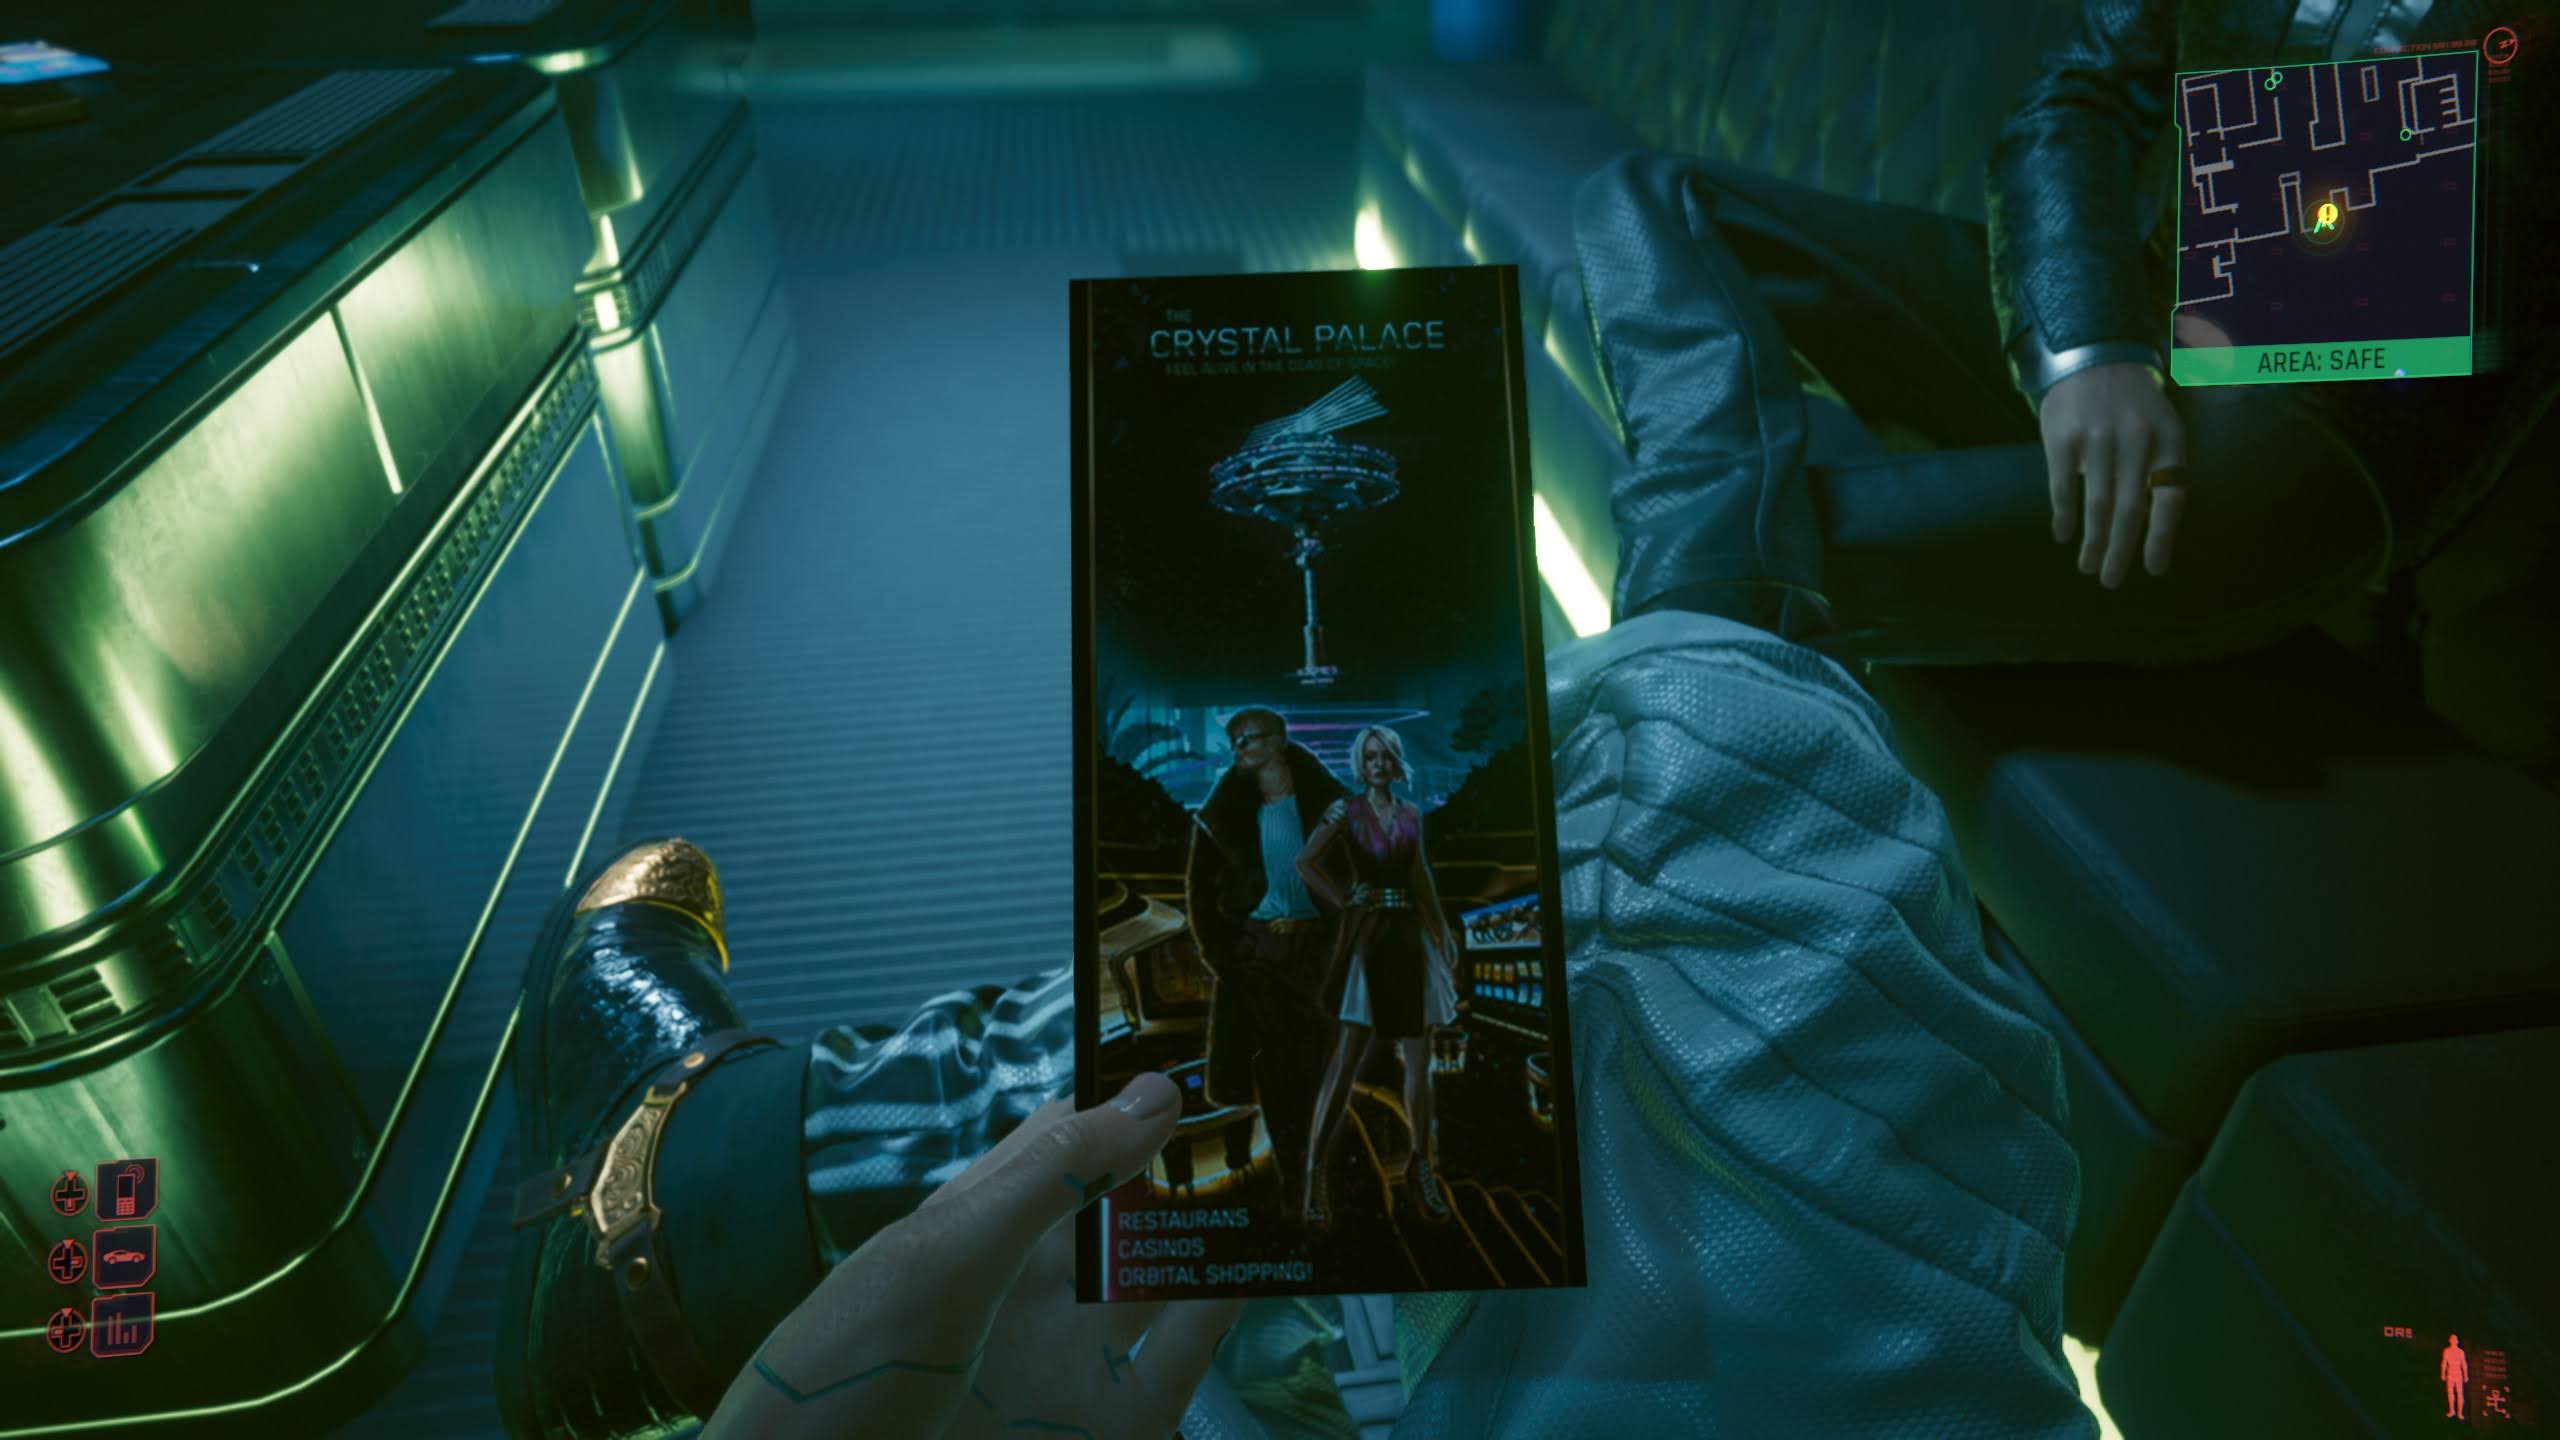
After the final mission, I found myself in that sterile, clinical medical facility in orbit. The tests, the isolation, the coldness of the Arasaka staff—it was crushing. I realized that in my desperate attempt to “live my own life,” I had walked right into the dirty hands of the corporations. I became the very thing Johnny Silverhand had been fighting against. I thought I was being pragmatic, but I was actually selling out—and in this universe, selling out is a fate worse than death.
Then the credits rolled, and the video messages started coming through. Hearing someone say, “You’re up with all the rich and famous people now…” was nauseating. I wasn’t a legend; I was a digital file in a corporate database. I felt like I betrayed Johnny. I started the game wary of him—“can I really trust him?”—but by the end, he was the only one being honest. He didn’t want to save my body; he wanted to save my will. By choosing Arasaka, I kept my body but lost my soul.
VI. Conclusion: Engram or End Game
I originally started my journey as a Corpo, so in a way, this ending was a true reflection of the path I began on. It was hollow. It was sterile. And it was a mistake.
You often have to walk the entire length of the wrong road just to realize exactly why you should have turned back at the start. I had to see the cold reality of that space station to realize that Johnny’s chaotic rebellion had more humanity in it than anything the corporations offered. I lied to myself about what we were fighting for.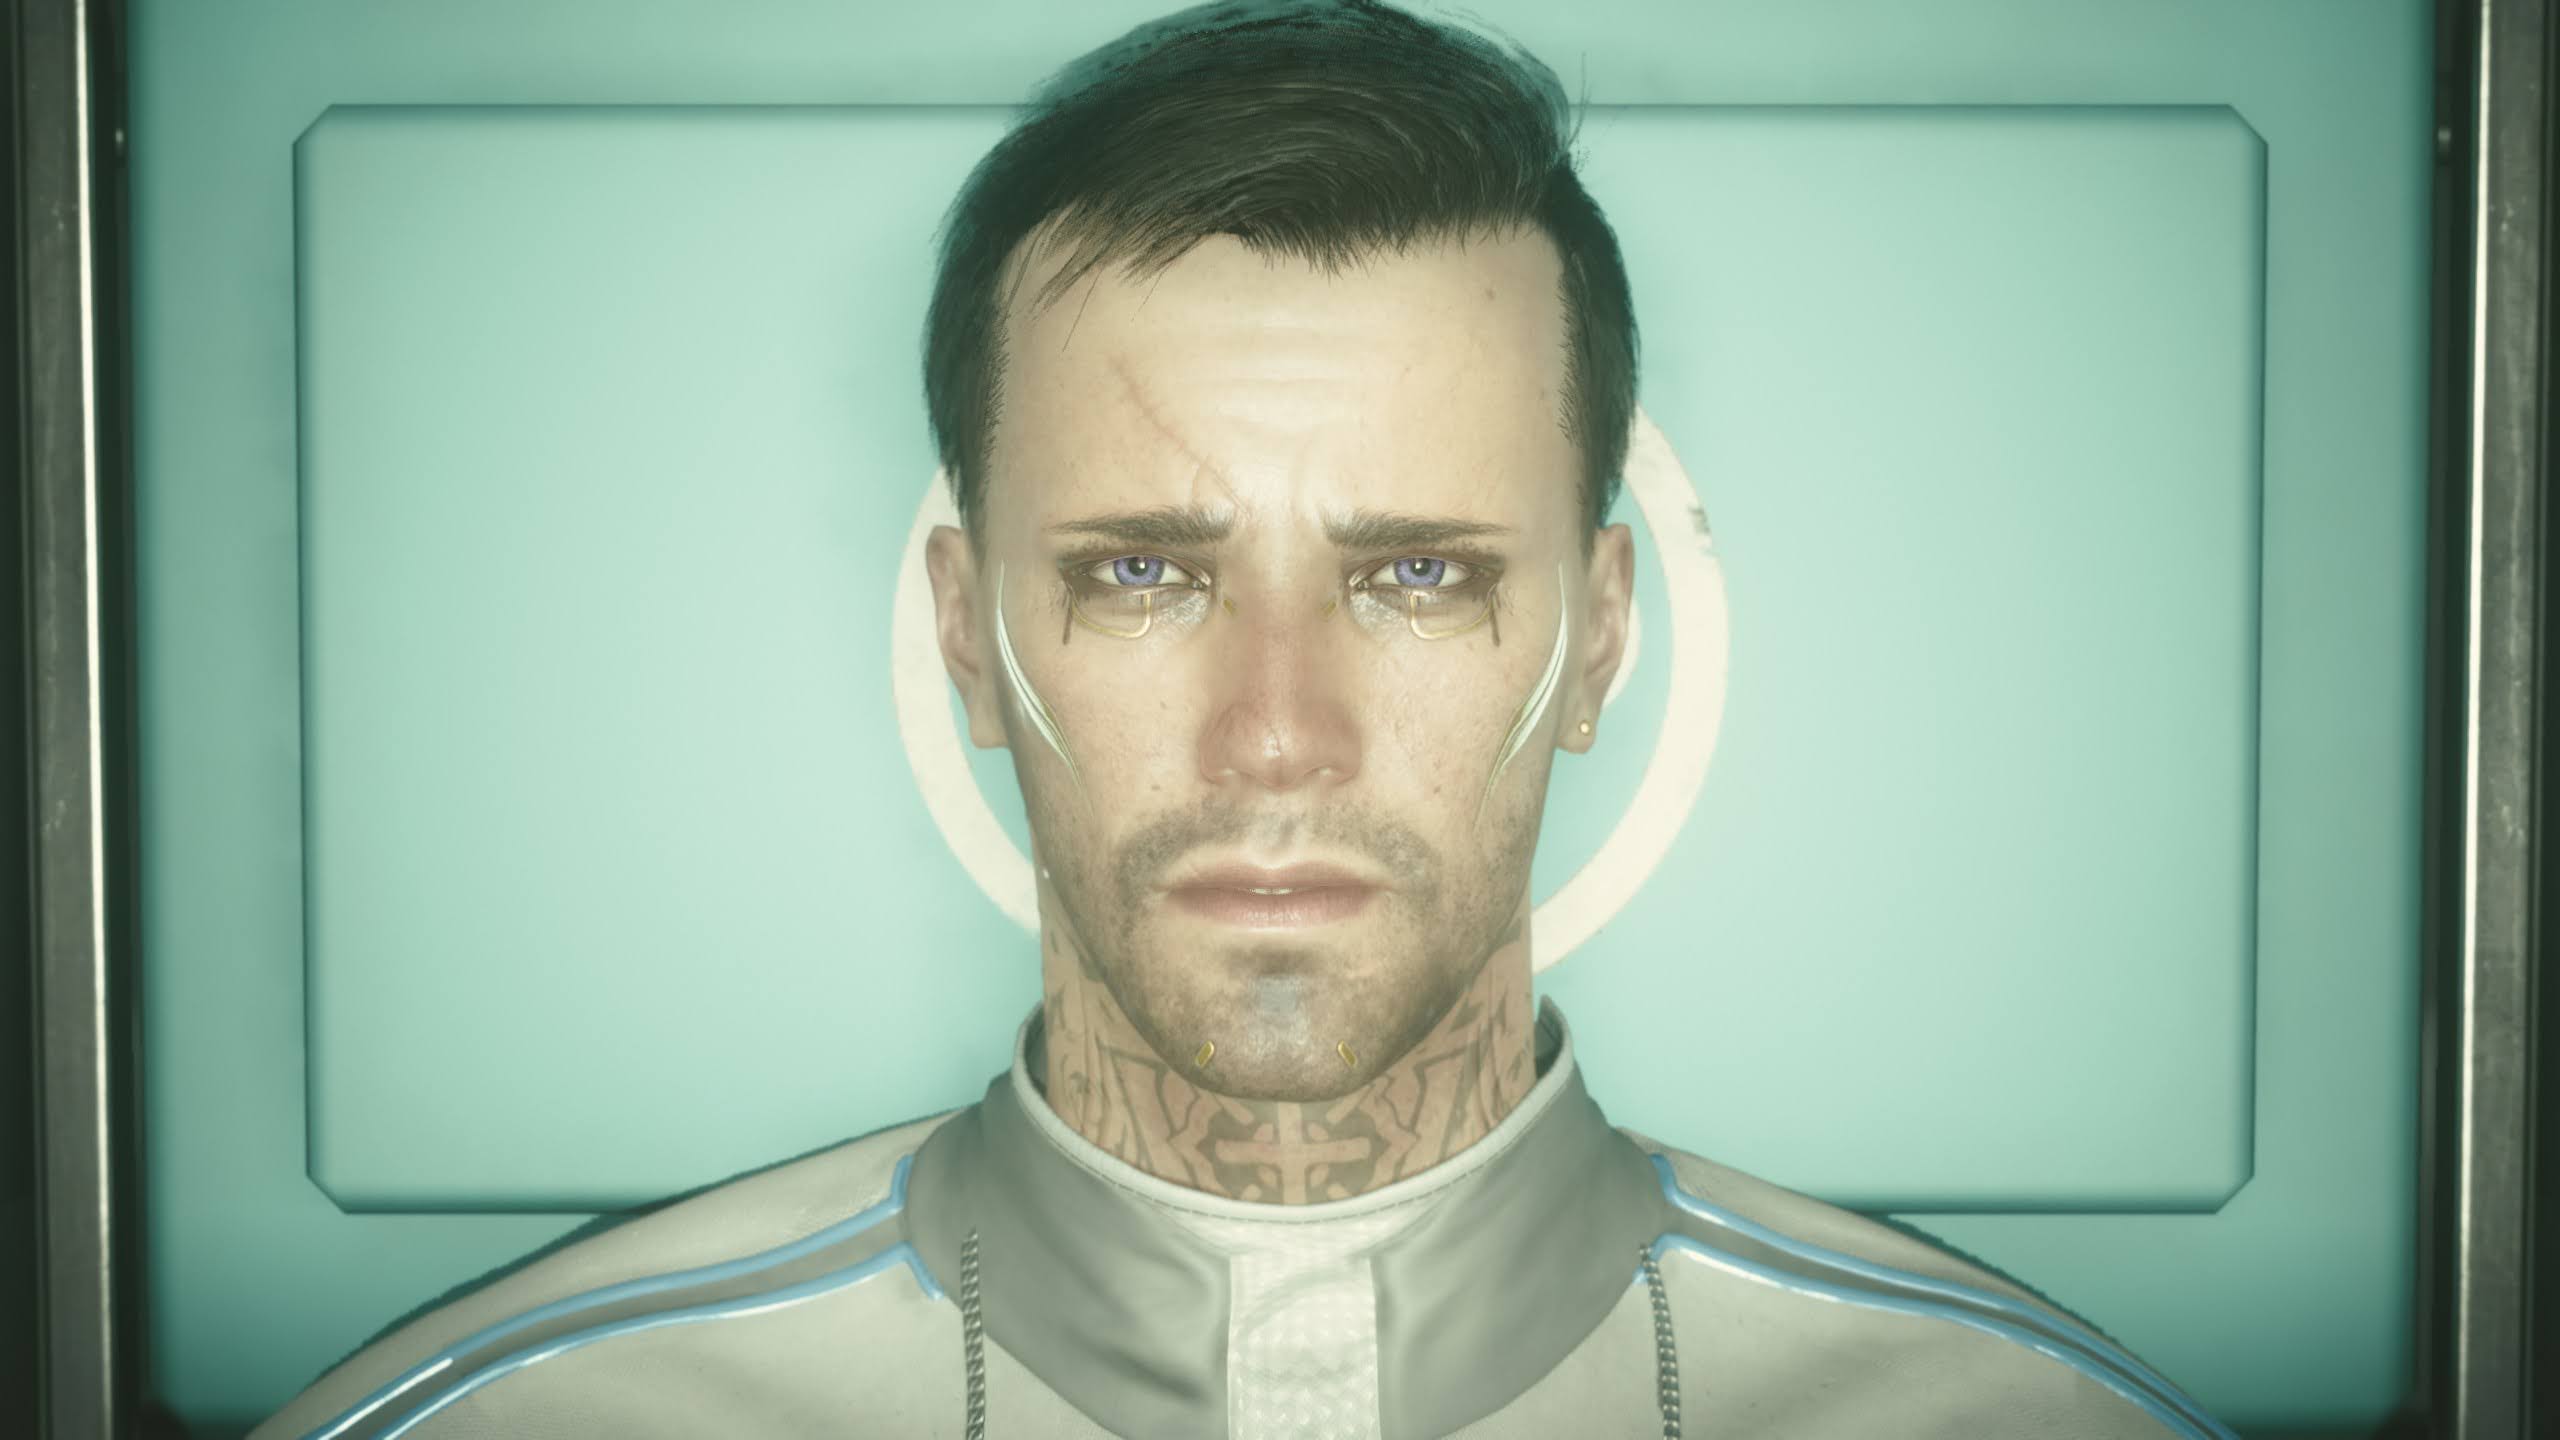
Usually, I’m a “one and done” type of player. But for the first time, I genuinely feel I need to go back. I need to fix the mistake I made. I owe it to Johnny—and to the version of V that didn’t give up—to find an ending that doesn’t involve sitting in a golden cage. As Johnny once said:
“You sold your soul, V… And the worst part is, you didn’t even get a good price for it.”
Night City won this round, but I’m not done with it yet…
VII. Epilogue
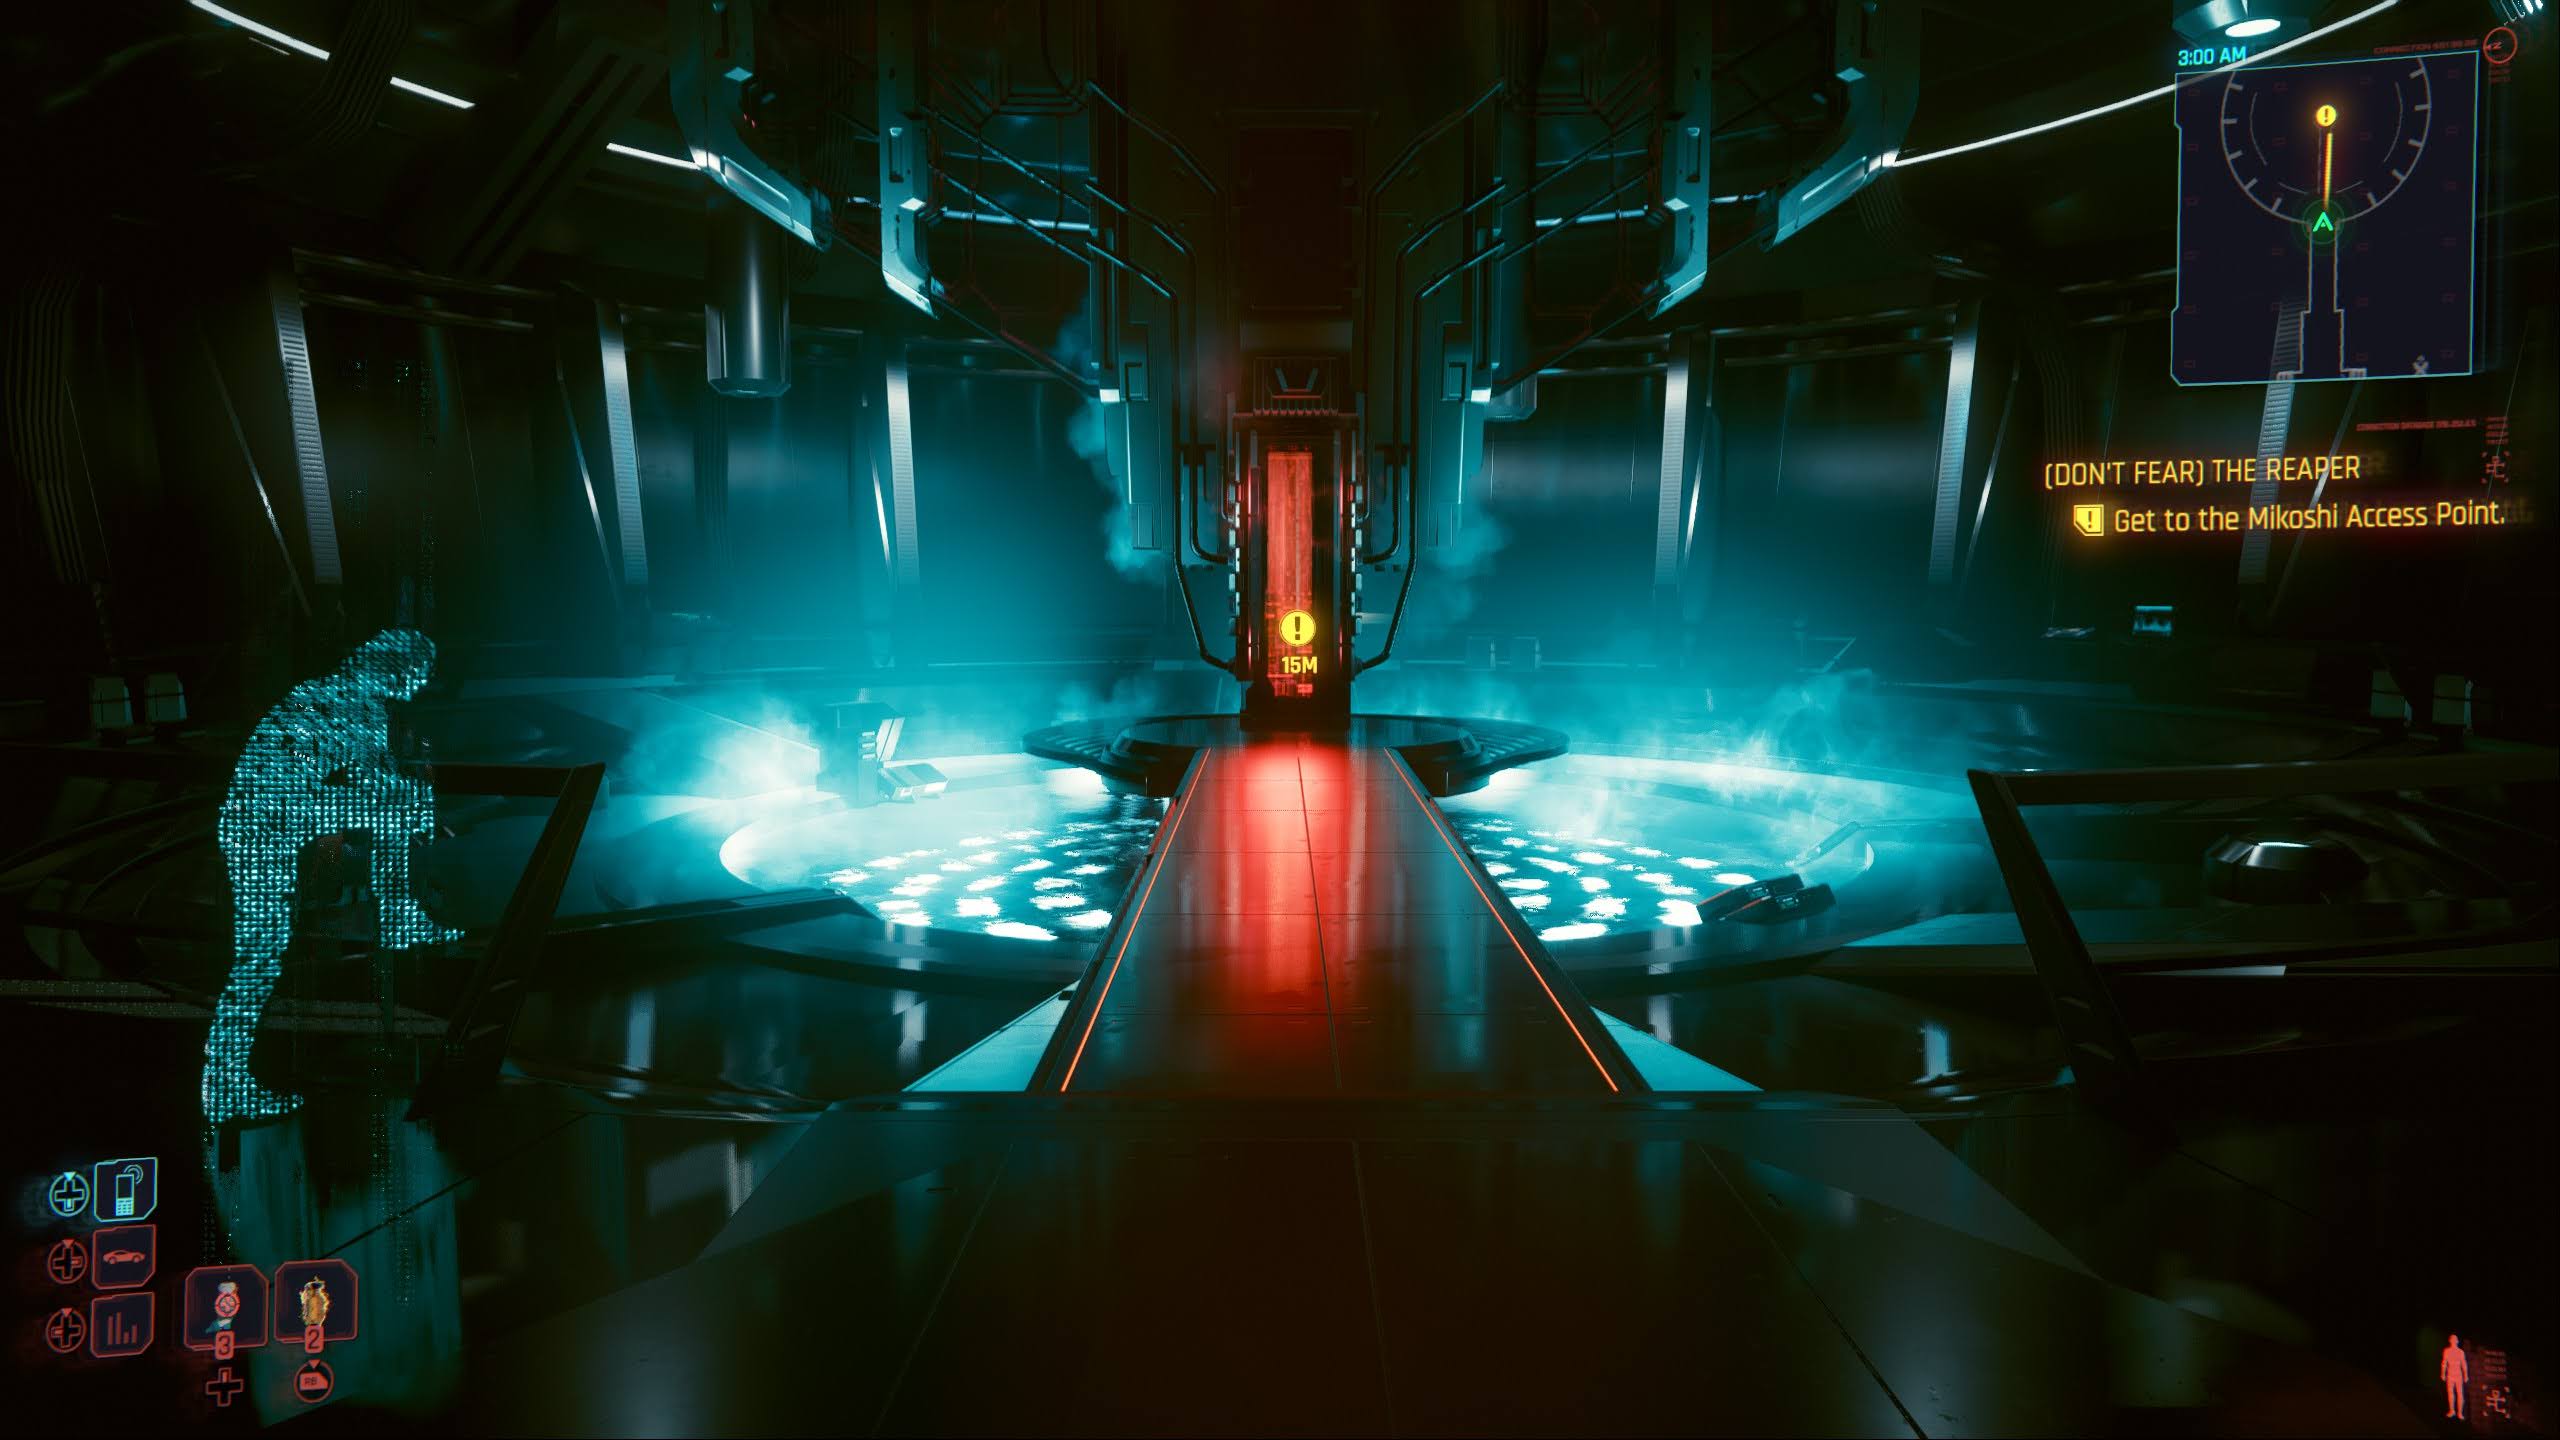
fter much reflection, I went back… but this time with my best choomba, Johnny Silverhand. (Don’t Fear) The Reaper is supposed to be difficult, but with new-found purpose and trust in my partner, I knew it was the right choice. It was pure preem carnage—no collateral, no backups, just two ghosts showing the suits that some assets can’t be liquidated. I traded a permanent, sterile seat in Mikoshi/Secure You Soul fortress for the throne at the Afterlife. My legend isn’t defined by a corporate contract, but by the mark I leave on the world through the choices I make.
“It’s not about how you live, V. It’s about how you die. And what you leave behind.”


")